O-TE-SA-GA or Otsego Lake?
Native Americans inhabiting the Otsego Lake watershed called the lake O-TE-SA-GA. It provided them with an abundance of food and water. It is certainly our area's greatest natural resource. Currently, Otsego Lake's 74 square mile watershed is home to more than 5,000 people, enjoying its beauty and bounty. The Lake is also the beginning or “headwaters” of the mighty Susquehanna River, which runs from our Leatherstocking Country via Pennsylvania to the Chesapeake Bay. It is the single largest fresh-water source for that magnificent bay.
The Plan for the Management of the Otsego Lake Watershed
Otsego Lake's Geology
Ten thousand years ago Otsego Lake was formed when a tongue of the continental glacier scoured out the Susquehanna River Valley and the Finger Lakes Region. Glacial scouring exposed limestone which has protected the lake by neutralizing the effects of acid rain. The limestone in the watershed and basin of Otsego Lake are dissolved by the waters flowing into it where it settles to the lake bottom as white marl.
Stratified Lake Sediments (Click to Enlarge)
Otsego Lake Water Quality Data
BFS Staff monitor Otsego Lake bi-weekly throughout the year (monthly when it's frozen) for a variety of physical and biological parameters. Results of this routine monitoring are summarized each year in the BFS Annual Report. Lake and weather conditions are also being monitored continuously between April and December as part of a project funded by the National Science Foundation - details can be viewed on Dr. Yokota's website.
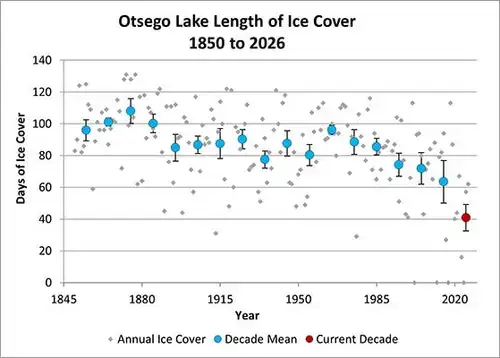
62 Days of Ice Cover Recorded for Winter 2025-2026. Ice formed quickly overnight Jan 23-24, 2026. Ice thickness of about 9 inches was observed mid-lake (TR4-C) in February. The lake was ice-free on March 27, 2027.
HISTORICAL RECAP: 2024 (Dec. 2023 to March 2024) marked the 4th winter on record without complete ice-cover formation. In 2023, complete ice-cover formed on 04 February 2023 and the lake was completely free of ice by 20 February (total duration of 16 days), though partial ice-cover formed south of 5 Mile Point and remained intact through March 2023. Records of ice cover on Otsego Lake date back to 1842; annual length of ice-cover since 1850 is presented in the graph below. Between 1842 and 2001, complete ice-cover existed each winter. Zero days of complete coverage were recorded for the winters of 2001-2002, 2011-2012, 2016-2017, and 2023-2024.
The “Real” Otsego Bass
William Cooper arrived at the south end of Otsego Lake in 1785 and founded the settlement that was to become Cooperstown. The original 200 families nearly starved one spring. Cooper wrote that, “unusual shoals of fish were seen moving in the clear waters of the Susquehanna... I was surprised to find that they were herrings... In less than two days each family had an ample supply.” Those fish were probably shad, which are like herring and a close relative of the Otsego bass.
Otsego bass are actually whitefish which are native to the lake. However, in the 1900s hundreds of thousands of other whitefish were added to augment native populations. The Otsego bass -- also called greybacks or humpbacks by local anglers -- are a close relative of the cisco which had been introduced inadvertently when whitefish populations were being augmented. The cisco have declined dramatically in recent years because of the illegal introduction of alewives, another herring-like fish. The alewife population exploded and severely reduced the cisco food source; in recent years, predation on alewife by stocked walleye has drastically reduced the alewife population. A shift in the forage base for game fish is underway and the stage may be set for a rebound of Otsego Bass. Lake whitefish successfully spawned in 2014 - 2017 and multiple size classes were obtained via anglers and NYS DEC netting efforts. Rainbow smelt abundance has also been on the rise.
While Otsego bass and cisco are no longer the focus of anglers, the lake supports many game fish. These include lake trout, walleye, largemouth and smallmouth black bass, rock bass, sunfish, chain pickerel, yellow perch, carp and bullhead.
The Food Web at the Bottom of Otsego Lake
Plankton serve as the basis of the food web for those animals living in the open water of the lake, but an entirely different assemblage of organisms lives on the bottom. In shallow water, many species of rooted aquatic plants and algae live, transforming the sun’s energy and providing food and cover for a whole diversity of small animals which are fed upon by the larger fish. Plant plankton, which form the basis of a lake's food chain, reflect the green color of all plants which fix energy from the sun.
In deep water, dead plankton rain down from above. Their remains are food for the pea clams, midge larvae (bloodworms) and freshwater earthworms that occur by the millions. In turn, these animals serve as food for the Otsego bass, lake trout and other bottom feeding, cold-water fish.
In 2007, zebra mussels (Dreissena polymorpha) were discovered in Otsego Lake and in 2020 quagga mussels (Dreissena bugensis) were documented; both have contributed to increased water clarity and additional changes to the food web within the lake system are expected. Native freshwater pearly mussels (family Unionidae), also filter-feeders, have been negatively impacted by these Dreissenid mussels. Six species of clams once occupied the soft substrates of Otsego Lake, however, no live clams were observed during a 2016 survey of the unionid community.
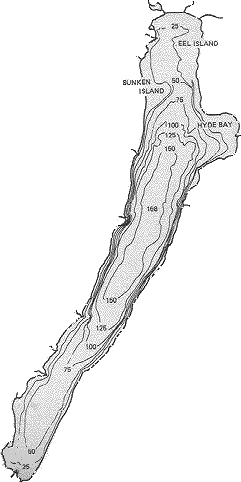
Download a hydrographic map of Otsego Lake
Otsego Lake Contour Map with 10' Contours (MS Word)
Otsego Lake Contour Map with 10' Contours (pdf)
The State of Otsego Lake, 1936-1996
This text document was produced by the Biological Field Station in Cooperstown, part of SUNY Oneonta. Please note this page contains the document's text only, figures and tables are accessible by downloading the PDF files. Data referenced in the following sections remains as written in the original publication (Harman et al. 1997; see the entire document as published: BFS Occasional Paper No. 30)
A hard copy of the report, including over 200 pages of graphs and tables, is available free of charge from the:
Biological Field Station
5838 State Hwy 80
Cooperstown, NY 13326
"It is imperative that existing phosphorus sources, as well as ...actions that could increase its loading or availability, be mitigated aggressively," according to the just-published The State of Otsego Lake, 1935-96. The study, the text only of which follows, was produced by the Biological Field Station in Cooperstown, part of SUNY Oneonta.
Funded by the U.S. Environmental Protection Agency via New York's Department of Environmental Conservation, the study said that "...the importance of protecting Otsego Lake's quality is paramount with regard to it being the primary potable water source for the Village of Cooperstown and many lakeside residences."
The authors, Willard N. Harman, Leonard P. Sohacki, Matthew F. Albright and Daniel L. Rosen, also pointed to the fact that "... a majority of the changes most seriously affecting the recreational use of Otsego Lake over the last 30 years have been the direct result of introductions of exotic organisms." Measures to reduce the probability of successful colonization by these organisms must be included in any management plan.
The loss of deep-water dissolved oxygen concentrations are starting to trigger sediment-bound phosphorus release. This internal loading can "...render ineffective comparatively inexpensive, normally recommended, non-point source pollution strategies "to help offset external loading. The authors assume that "...there is still an opportunity to reverse this trend." The data presented in the study "...reveal a situation that pleads for timely and effective action."
Calculations indicate ".... serious lakewide problems regarding environmental quality." The report points to the disappearance of stoneflies and a dramatic reduction of caddisflies and mayflies, a very important development in view of the fact that these insects are pollution sensitive.
The study stresses that "...the delicacy of the Otsego Lake ecosystem requires special emphasis." The internal and external changes which have taken place resulting from nutrient loading plus introductions of exotic organisms have negatively impacted those characteristics most valuable to residents and visitors alike. They are a clear, ecologically stable lake, a potable water supply, and extraordinary recreational opportunities.
This contribution, "The State of Otsego Lake, 1936-96", has been assembled to provide information characterizing Otsego Lake and its watershed. It is the result of 27 years of research at SUNY Oneonta's Biological Field Station, culminating in the United States Environmental Protection Agency (USEPA) funded, New York State Department of Environmental Conservation (NYSDEC) sponsored Phase 1 Diagnostic/feasibility study. Matching funds for the latter work were provided by the Otsego County Conservation Association which has also funded, in whole or in part, many of the earlier studies utilized in this report.
For their timely, thoughtful and thorough reviews, the authors wish to thank: Dr. Joseph Makarewicz, Chair and Prof., Dept. of Biological Sciences, SUNY Brockport; Dr. Ray T. Oglesby, Prof., Dept. of Natural Resources, Cornell University; Dr. Kenton Stewart, Prof., Dept. of Biological Sciences, SUNY Buffalo; and Dr. Steven Effler, Dir. of Research, Upstate Freshwater Institute, Syracuse. We thank Dr. Robert A. Daniels, Curator of Ichthyology, NYS Museum, for his review of the fisheries oriented sections. Thanks also to Kathy Ernst whose graphics efforts greatly enhance the quality of this publication. Lastly, special thanks to the scores of interns, assistants, students and visiting researchers whose efforts were essential to this report.
This report was compiled and written as part of the requirements under the Clean Lakes Program (Section 314, Clean Water Act) grant award to the NYSDEC from the USEPA (award number S002296-01, July 1, 1991).
In 1612, two Dutch explorers traveled from the junction of the Mohawk and Hudson Rivers westward up the Mohawk, crossed overland to Otsego Lake and then south down the Susquehanna (Cooper, 1920). This link that the lake provides in joining the Mohawk and Susquehanna watersheds has had important effects on Otsego and its utilization throughout recorded history. Cadwallader Colden, the New York State surveyor-general, reported 125 years later (1737), "At 50 miles from Albany, the land carriage from the Mohawk River to a lake (Otsego), from whence the northern branch of the Susquehanna takes its rise, does not exceed 14 miles. Goods may be carried from this lake in battoes, or flat-bottomed vessels, through Pennsylvania to Maryland and Virginia, the current running everywhere easy." (Shaw, 1886).
The first settlement in the area was constructed by the Rev. J. C. Hartwick in 1761. It was abandoned soon thereafter when he discovered that his patent was located somewhat farther south along the river. A few years later (1770) George Croghan built a home and lived along the lake with his family until the Revolutionary War. During that time Indian activity precluded habitation by settlers and the area was abandoned. Soon after, Generals Sullivan and Clinton were sent into central New York to bring a stop to the activities of the Indians. In 1779, Clinton moved south from Canajoharie overland to Otsego Lake with 200 boats and 1,500 troops. His mission was to travel down the Susquehanna and join forces with Sullivan at Tioga. When he found the river waters too low for navigation, he dammed up the flow from the lake, released it, and floated downstream on the crest of the flood (Cooper, 1920).
In 1785, William Cooper arrived at the south end of Otsego Lake and founded the settlement that was to become Cooperstown. The aquatic resources of the region soon became recognized. A few years after settling late spring saw 200 families in the village bordering on starvation. In the words of Cooper:
"A singular event deemed sent by a good Providence to our relief; it was reported to me that unusual shoals of fish were seen moving in the clear waters of the Susquehanna. l went, and was surprised to find that they were herrings (probably American shad, Alosa sapidissima). We made something like a small net, by the interweaving of twigs, and by this rude and simple contrivance we were able to take them in thousands. In less than two days each family had an ample supply (Lynch, 1965).
Commercial fishing for cold-water fish species soon became an enterprise (Shaw, 1886) that was active on t he lake until the introduction of alewives (Alosa pseudoharengus) in 1988. Seining for Otsego Bass was first recorded in 1789 and continued until 1915 when it was permanently banned. In 1896, the holders of 42 seine licenses recorded catches of 1,100 kg of these fish. Gill netting was introduced in the 1850's. Between 1855 and 1867, single hauls containing in excess of 5,000 Otsego Bass were recorded. Seining also caused a drastic reduction of lake trout and was banned in 1915 (Birdsall, 1917) .
In 1870, Elihu Phinney built a hatchery on Three Mile Point, and over the next few years many thousands of fish were stocked. It was at this time that commercial transportation on the lake was developed to facilitate access between rail traffic in the Catskill area and that from Albany to Buffalo via rail and the Erie Canal. Recreational possibilities were also recognized (Bacon, 1902).
The first steamboat on Otsego Lake was launched in 1858. The last commercial steam vessel plied the lake in 1933. During the height of these activities, in 1894, ten steam-powered boats were active on the lake. At least two, the "Natty Bumppo" and the "Cyclone," could hold more than 300 passengers each (Ketchel, 1963).
In 1935, the New York State Conservation Department funded the first biological survey of the Delaware and Susquehanna watersheds. Otsego Lake was included in those studies (NYS Conservation Department, 1936). Data were collected concerning water chemistry, physical limnology, plankton, seston (all particulate matter suspended in the free water), benthos, nekton (fish), and aquatic vegetation.
In 1968, access to the lake and lands for a field station were acquired by the SUNY Oneonta to initiate the development of a biological research facility. Concurrently, the Otsego County Conservation Association (OCCA) was formed by an influential group of local landowners and sportsmen concerned about environmental quality as it related to natural resource maintenance and utilization. Their first focus was on forest productivity and marketing. However their attention was soon drawn to land management/water quality relationships, eutrophication and concerns about fluctuating water levels in Otsego Lake. They developed a policy of supporting the Biological Field Station (BFS) in order to acquire information to develop their water quality agendas. Two early outcomes were: New York State recognition of the surface elevation of Otsego Lake to clarify agency responsibilities, and the replacement of a wastewater system in Glimmerglass State Park which polluted the lake.
In 1980, the New York State Department of Environmental Conservation (NYSDEC) published a series of volumes on "The Lakes of New York State" edited by J. A. Bloomfield. Volume 3, "The Lakes of East-Central New York" included a chapter on Otsego Lake (Harman, et al., 1980). That work summarized all the information on Otsego Lake water quality available at the time. This report is an update of that work with the earlier material serving as a base upon which present lake characteristics can be compared.
Public Health Law 1100 was implemented in 1985 by the Village of Cooperstown for the protection of their water supply.
In 1992-4, a spate of citizen groups became active, and local government initiatives flourished, as concerns relative to recreational use of the lake focused around phosphorus loading, the future of the cold-water fishery, introductions of exotic organisms, and lake access.
The characteristics that a body of water exhibit are a reflection of local bedrock, soils, stream flow, and other hydrological influences, and climate. The attributes of these physical factors, plus those of the biota, determine nutrient loading and cycling, which is of critical importance.
In recent years, the effects of man on aquatic ecosystems have become more and more apparent; therefore, land cover and utilization, population distribution, and the socioeconomic characteristics of watersheds are important variables in ascertaining lake quality.
Otsego Lake fills a depression formed by the over deepening of the headwaters of the Susquehanna River by Pleistocene glaciation. It is unique; other local lakes of its shape and size drain north via the Oswego River into the St. Lawrence watershed. The flora and fauna are represented by organisms typically found in morphometrically oligotrophic lakes (as indicated by some Finger Lakes), but some associations have been derived from taxa typical of the Atlantic coast drainage and are, therefore, different from their counterparts in the Finger Lakes region.
With a maximum depth of 50.5 m (166 ft), Otsego is one of the deeper lakes in New York State. This characteristic, combined with a preponderance of narrow, precipitous shores, results in a comparatively restricted phototrophic zone. This phenomenon, in turn, is directly responsible for the maintenance of the aesthetic qualities of Otsego despite appreciable nutrient introduction from natural and cultural sources.
Text for this section is provided below; For the full chapter, including text, figures, and tables, view the PDF document: Population Distribution
In 1994, the total population in the watershed was estimated at 2,097 (2.74 people/dwelling) (Carlton, 1994). Summer residents increased that total by approximately 1,000. This compares with 2,073 in the early 1970s with no data on the number of summer residents. Watershed residency is broken down by the municipality in Table 1.
This population was housed in 764 permanent residences and 368 seasonal dwellings. The numbers of residences along Otsego Lake's shoreline have grown phenomenally over the past 125 years. In 1868, there were 40 dwellings excluding those in the Village of Cooperstown (Beers, 1868). In 1937, aerial photographs showed at least 147 homes (Harman et al., 1980). Photographs taken in 1969 show 273 (U.S. Department of Agriculture, 1969). In 1994, within 300 meters of Otsego Lake's shoreline, there were 76 permanent and 331 seasonal dwellings (Albright, 1996.) housing nearly 1,150 people during the summer. During 1993, public and commercial establishments along the lake employed, year around, 110 full time and 27 part-time workers. Seasonal workers were 133 and 5 42, respectively. Over 330,000 people visited these establishments in 1993 (Albright, 1996).
In 1868, there were an estimated 875 people using the lake on pleasant summer weekends including residents, those on steamboats and at the Three Mile Point public park (Harman et al., 1980). Today, about 7,000 people visit Glimmerglass State Park on a nice, summer Sunday. Current residents and their guests as well as visits to additional public and commercial establishments result in nearly a 350-fold increase in weekend population pressure.
Text for this section is provided below; For the full chapter, including text, figures, and tables, view the PDF document: Socioeconomic Characteristics
In the three towns surrounding Otsego Lake, the average family income is $39,970 (Carlton, 1994). Large changes have occurred since the 1970 census. Percentages of family incomes in selected categories are compared in Table 2. The percentage of employed population 16 years old and over by occupation is shown in Table 3.
There has been a significant drop in farm-related and service occupations in the area. That change, coupled with a sharp increase in professional, technical and administrative jobs, helps explain a higher average income as well as the declining proportion of workers in lower income brackets.
Underpinning occupational and income gains has been a dramatic increase in years of education. Where only 27 percent of the area's population went beyond high school in 1970, in 1989 nearly 50% did (Table 4).
Higher income (including that of seasonal residents not included in the census figures) leads to the purchase of more big-ticket recreational items such as powerboats. This perhaps can be inferred from the fact that in the l970s, the vast majority of outboard engines used on Otsego Lake was less than 35 hp (Thayer, 1994). Nationwide, average engine power was 29 hp in 1968 (Asplund, 1995). In 1994, most outboards were larger than 40 hp. Inboard-outboards which are typically 140 hp or more numbered well over 200.
A census of boats made on Sunday, August 10, 1975 resulted in a total count of 1,070 boats (Otsego County Conservation Association, 1975). More than 50% were small motorcraft. Boat tallies taken between then and 1980 illustrated gradually decreasing numbers. In 1980, only 408 boats were counted around and on the lake. Powerboats numbered 254, 70 were rowboats and canoes, and 95 sailboats made up the balance. Throughout the 1980s, numbers increased. Boat censuses taken between 1990-94 recorded an average of more than 1,100 boats with ready access to the lake. On a busy weekend, 150 boats or more could be counted on the lake. Powerboats typically made up 58% of the total, rowboats and canoes 25% while sailboat s constituted 17% (Otsego County Conservation Association, 1994). Methodologies utilized in these censuses are described in Harman and Lindberg (1991).
A proxy for boat usage on the lake is the number fishing boats. Aerial counts of boat anglers between 1961-63 and again in 1975-76 indicated that 19,000 trips were made between May-September of those years. However, in 1990 use had declined to about 12,000 trips (Sanford, 1994). Paralleling these observations are boat rentals from Thayer' s boat livery, formerly the largest on the lake and one whose customers were predominantly fisherman, renting low-horsepower aluminum boats. In the 1970s, 50-75 boats were rented daily (Thayer and Thayer, 1970). By 1988, daily rentals were down to less than 20 (R. J. Thayer, 1989). Part of this decline might be partially attributed to the increase in boat ownership which, other things being equal, would reduce the demand for rentals. However, the strongest inference that can be drawn from declining angler usage (Sanford, 1994) was that the lake fishery had become less diversified and appealed to a smaller public.
In the 1960s and 70s more than 90% of Thayer's customers were fishermen, the majority trolling or still fishing for cisco, whitefish and walleye at dawn and dusk. A large number of "family" fishermen fished for smallmouth and largemouth black bass, pickerel, yellow perch, panfish and bullheads (Thayer and Thayer, 1970). When Thayer's closed in 1988 most of the customers were non-fishermen. Those fishing were, for the most part, after lake trout (Thayer, 1994).
Thayer's closing, parking restrictions near the Cooperstown public launch and the closing of Springfield landing to non-residents has made boating access more inconvenient, probably contributing further to the decline in trips (Sanford, 1994).
This section includes text-only for portions of the Drainage Basin description. For the full chapter, including text, figures, and tables, view the PDF document: Drainage Basin
This section contains the following sub-sections:
- LAND USE
- GEOLOGY
- SOILS
- GROUNDWATER HYDROLOGY
- CLIMATE
- STREAM FLOW AND QUALITY (PDF only)
LAND USE
Figure 2 indicates the land-use patterns in the Otsego Lake watershed in Otsego County (Komorowski, 1994) on July 30, 1988 ( satellite fly over). The total catchment area of Otsego Lake is 18,811 ha (72.6 square miles). Forty-four percent of the watershed is utilized for some type of agriculture, 36% is forest dominated by second-growth hardwoods (birch, beech, maple in the south; american ash, hickory and their associates occur in areas of less relief in the northern portions of the watershed). Conifer forest comprises 2.4% and brushland 14.5%. Residential, industrial, and commercial use (indicated as "settlements") and transportation cover 0.86% of the available land area. The balance is wetlands and water bodies. The lands utilized most intensively for agriculture are those derived from local limestones. Nutrient runoff inherent in those soils is greatly enhanced by this type of use. Tables 5a and 5b describe land cover by sub-drainage basin, acreage and percent of the watershed.
GEOLOGY
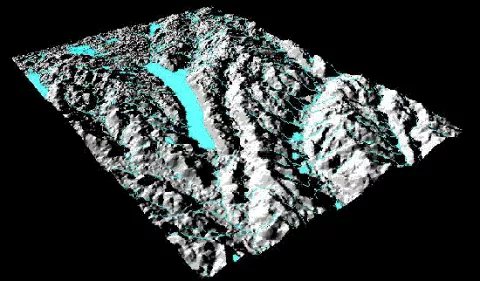
Otsego Lake lies in the glacially overdeepened headwaters of the Susquehanna River in Otsego County, New York (42E40'N-70E00'W ) within the northern portions of the Appalachian Plateau. It is oriented, with its main axis north to south, in a glacially overdeepened valley at an elevation of between 364.2 and 364.5 m. The lake is enclosed on the east and west by truncated slopes rising to the divide at a height of about 610 m. The lake is bounded on the northern end by the Richfield Springs drumlin field and on the south by an end moraine and outwash plain that dammed the valley and impounded the waters trapped therein. Detailed studies concerning the glacial history of the Otsego Lake region are available (Sales et al.,1978; Fleisher, 1978; Fleisher and Mullins, 1990).
The parent rocks in the watershed (Figure 3) were deposited as marine sands, silts, clays, and carbonates in the Appalachian geosynclinal sea during the Lower and Middle Devonian Period. Most of the Susquehanna watershed lies on acid sandstones and shales low in calcium and other compounds important in organic metabolism. In this region they are the Hamilton-Panther Mountain and Marcellus formations which are roughly 100 meters in thickness. However, the north end of Otsego Lake and the greatest portion of its watershed lie on the southern exposure of the Onondaga limestone formation (ca. 30 m thick) and drain areas of the older (Lower Devonian) Helderberg limestones to the north. This results in naturally hard, productive waters, appearing incongruous when viewed between unproductive hills of arenaceous shales and siltstones.
Glacial outwash, till, and alluvial sediments have partially filled the lake basin and valleys to the south to depths as great as 75 m compared to roughly 15 m in areas north of the lake (Fleisher and Mullins, 1990).
SOILS
The soils derived from the above-mentioned formations and Adirondack derived materials carried south by the Pleistocene glaciers a re extremely diverse. They are dominated by poorly drained, acid, shallow soils in the south and by excessively drained, productive soils of fluvial or glacial origin in the valleys to the north (Komorowski, 1994) (Figure 4). Problems concerned with nutrient runoff occur in both types of soil associations. Figure 1 illustrates the patterns of soil limitations to septic tank absorption fields throughout the watershed while Figure 4a shows soil limitations for the construction of roads and streets (Department of Geography, 1994). Detailed soils maps and associated explanations are presented in Anon. (1990).
GROUNDWATER HYDROLOGY (Palmer, 1975; from Harman et al., 1980)
Virtually the entire effective yield of groundwater in the local bedrock is transmitted through fractures, rather than intergranular pores, as is typical of most geologic regions. The effectiveness of these fractures in transmitting water varies with the rock type and depth below the surface. In the limestone, it is common for the larger fractures to have become enlarged by solution. Most of these openings are joints cutting vertically across the bedding, although numerous bedding-plane partings contribute a great deal to the permeability. Fractures are distinct and favorable to water flow. Solution by groundwater creates a very heterogeneous permeability within these limestones. Compared to other local bedrock units, limestone's hydraulic properties produce quantitatively more but qualitatively poorer well yields. The increase in fracture size by solution reduces the filtering of pollutants so that tests of the effectiveness of septic systems and well-water purity are essential.
Local shales tend to crumble when fractured so that clean distinct openings are rare. Because of the interbedded nature of the shales and sandstones it is common to have perching of groundwater along the tops of shale beds. Emergence of groundwater as it seeps along such contacts along the hillsides above the lake shores is extremely common and precludes the effective use of traditional septic systems. Down-dip flow is favored, particularly because the dominant joint direction is roughly parallel to the dip, although this tendency is obscured in the local area by the comparative lack of down-dip exposure and because the valley drops in elevation roughly equal to the dip.
The hydraulic transmissivity of fractures in bedrock increases by the cube of the effective fracture width. Although this functional relationship does not allow quantitative determination of localized groundwater flow problems because of the heterogeneity of the geologic setting, it is useful in explaining the variation in transmissivity with the same bedrock unit from place to place. Fracture width increases with weathering and erosional unloading of overlying rocks. The effect of each process decreases rapidly downward from the surface, so that the effective fracture width diminishes downward. Consequently, there is a radical decrease in transmissivity downward below the surface in any fractured bedrock formation, particularly in a rather non-deformed region such as the Otsego Lake watershed. Therefore, groundwater yields diminish with the depth of the contributing bed. As a general rule, if water isn't reached at a depth of roughly 90 m there is poor chance of encountering a usable supply by further drilling.
The valley fill material is more predictable in its yield of water because of its primary intergranular porosity. Unfortunately, the exact nature of the subsurface material is difficult to predict in detail without drilling. Gravel and sand lenses are very common and provide generous yields because of their high permeability, but finer grained sediments are even more common and have much lower yields of water. Patterns of gravel and sand bodies can generally be identified from well logs. Stratification of gravel and sand versus silt and clay is common, so that a poor well in the valley fill can generally be improved by deeper drilling and encountering lenses of higher permeability material. The permeability of this material is not seriously affected by increasing depths of overburden.
Deposits of glacial ti ll are distributed over the surface of the area in patches of irregular depth. In general, the thickness of till is greatest on the southern slopes of bedrock hills. This material should be avoided if possible as a site for septic systems and water wells because its permeability is negligible.
Reliable figures for well yield are rare in this area. Most values are given in terms of maximum pumping rate without drying up the well- a measurement that varies according to individual well depths, techniques for increasing well yield, etc., and provides very little information about the hydraulic character of the rock units in general.
In units of the type exposed in the Otsego Lake area, the following average well yields can be given: 1. Onondoga limestone -40 liters/min (great variation from place to place, depending on size and interconnectivity of solutional openings encountered); 2. Hamilton Group shales -40 liters/min average; 3. Valley sediments -75 liters/min average, as high as 375 liters/min not uncommon.
Water quality varies greatly throughout the watershed because mineralization increases with depth, as rates of water flow become smaller. A typical value for total dissolved solids is about 200 mg/l. Most of this dissolved material is Ca2+ and Mg2+, which renders the water of the area rather hard. For most industrial uses it would be necessary to soften the water obtained from wells both in bedrock and in the valley fill. Iron and manganese are of high enough concentration in local areas to cause a staining problem (up to 1.7 mg/l), in contrast with a normal standard of 0.5 mg/l.
Significant non-point source pollution of ground water is practically negligible in the valley fill material, and by virtue of low population, on the bedrock uplands. However, it is of serious concern where strip development has proceeded along the lake shores. Pollution of the groundwater in the areas where limestone is exposed north of the lake is a concern. Potential effluents should be avoided and disposing of garbage and animal carcasses in hollows and sinkholes should be discouraged.
CLIMATE (Pack and Hollis, 1973; from Harman et al.,1980; Hollis, 1994)
The Otsego Lake watershed is in a region possessing a humid-continental climate. The prevailing winds are westerly, generally shifting toward the north in winter and toward the south in summer. Otsego Lake is on the eastern border of a region affected by outbreaks of cold, dry polar air originating in Canada that occur frequently in late fall, winter, and early spring. When these winds are strong and follow trajectories across Lake Ontario, heavy snow squalls often result. In contrast, winds originating over the Gulf of Mexico or adjacent waters are common from May through October and provide the region with warm, humid weather. At times, air flow directly from the Atlantic invades the region, resulting in cool, damp, and cloudy periods.
In the winter months, the area lies in the path of storm systems that move toward the northeastern United States from the west or up along the Atlantic coast from the south. These storms and their associated fronts bring sharp changes in atmospheric conditions within short periods. In summer, storms tend to track north of the State into southern Canada. This produces less variable weather. There are times when rather warm weather in the summer or severe cold in winter may last for as much as a week or longer.
Summers are moderately warm, whereas the winters are long and cold. Temperatures usually rise slowly in the spring, but autumn is pleasant, with warm, sunny days prevalent well into mid- or late October. Precipitation is evenly distributed during the year. Maximum amounts are derived from winter coastal storms and summer thunderstorms. The watershed is located in the "General Appalachian Cloudiness Belt". It receives about 50% of possible sunshine annually, with a minimum of about 40% in winter. The following data have been collected from records available in Cooperstown, and are complete from 1854 to the present (Pack and Hollis, 1973; Hollis, 1994).
In the summer, the daily maximum temperature usually ranges from 20E-30EC. A temperature of 32.2EC (90EF) or higher occurs on an average of 5 days per year. Such a temperature has been recorded on as many as 14 days in especially warm seasons, but in two summers out of 10 the temperature fails to reach the 32.2EC (90EF) mark. The highest temperature eve r recorded in Cooperstown is 37.2EC (99EF). It was noted on two successive days, July 9 and 10, 1936. Between early December and early March, a temperature of -18EC (0EF) or colder is observed on an average of 18 days. The number of such days varies from 10 or less in mild winters up to 25 or more in abnormally cold seasons. Low winter temperatures may be expected to range between -9.4EC (15EF) and -3.8EC (25EF) in most years. The lowest temperature on record in the village is -36.7EC (-34EF) on February 9, 1934.
Annual precipitation averages between 99 and 102 cm. Extremes of precipitation in recent decades have ranged from 72.4 cm in 1964 up to 124.5 cm in 1945 and 1972. The maximum annual total measured at Cooperstown is 147.6 cm, recorded in 1890. Precipitation of 2.5 cm or more in a 24-hour period is likely to occur from six to eight times per year. Rain (5 cm or more) is recorded occasionally; daily amounts in excess of 7.6 cm are rare. Rainfall of 10.2 cm or more in a 24-hour period has been recorded on three occasions since 1854, the greatest amount being 12.3 cm on October 5 and 6, 1932.
The area receives an average snowfall of 198 cm per year. This compares with an average of about 254 cm in the extreme northern parts of the watershed and an average of only 152 cm along the southwestern border of Otsego County. Seasonal amounts in Cooperstown, at the south end of the lake, have varied from as little as 81 cm up to a maximum of 354 cm. More than 254 cm (100 in.) has been recorded in 10 winters since 1890, but usually the total has ranged from 152 to 241 cm. The heaviest single snowstorm recorded is 69.9 cm on December 26 and 27, 1969. Measurable snowfall usually begins by mid-November and continues into April, although in exceptional seasons 2.5 cm or more has fallen in the latter half of October and as late as May 10. About four storms yielding 12.7 cm (5 in.) or more of snow may be expected per winter. A snow cover of at least 2.5 cm normally prevails from early December until early April, but in some winters the ground may be bare for short periods.
While wind observations have not been taken on a regular basis, interpolation of records from nearby stations suggest that the prevailing wind is northwest in the winter and early spring with an average velocity of 450 to 670 cm/sec. The prevailing wind shifts to southwest or south in the summer and early fall and averages 360 to 535 cm/sec.
There are about 200 overcast days per year, more than half of which normally occur from November through March. About 60 to 70 days of clear skies may be expected per year. The average solar radiation is between 125 and 150 langleys/day in the winter, and between 500 and 550 in the summer (Berman, 1975), which is equivalent to approximately 1000 BTU/ft2/day annually. Thunderstorms occur frequently from May through September. The more intense storms may be accompanied by damaging lightning and wind. Intense rains sometimes occur with thunder storms, but damaging storms of large hail are rare. While heavy snowfall is to be expected, blizzard conditions are not common. The watershed is well removed from the normal path of hurricanes and tropical storms. However, such storms have caused damage in the Lake Otsego area. Major floods are practically unknown.
In late winter or early spring, the occasional combination of heavy rain and melting of a deep snow cover may produce inundation of low-lying areas. Intense rains from summer thunderstorms may also cause local flash flooding of small creeks and streams around the lake.
For the full chapter, including text, figures, and tables, view the PDF document: Limnological Characterization
This section contains the following sub-sections:
- PHYSICAL LIMNOLOGY
- CHEMICAL LIMNOLOGY
For the full chapter, including text, figures, and tables, view the PDF document: Descriptive Ecology
This section contains the following sub-sections:
- PHYTOBENTHOS
- PHYTOPLANKTON
- ZOOPLANKTON
- ZOOBENTHOS
- FISH (NEKTON)
For the full chapter, including text, figures, and tables, view the PDF document: Ecosystem Ecology
This section contains the following sub-sections:
- STRUCTURE
- TROPHIC STATUS
STRUCTURE
The many recent alterations in the structure of the Otsego Lake ecosystem are dealt with in greater detail in the relevant sections under "Descriptive Ecology". Some reiteration is necessary to provide a holistic view of system-wide biodiversity, biological integrity and ecological sustainability.
By biodiversity we mean species richness plus some evaluation of dominance. Biological integrity compares present species diversity with an earlier (presumed closer to pristine) state. Sustainability is a measure of integrity, including consideration of the presence or absence of, or the dominance of, exotic species. It is a measure of the ability of a community to maintain its ecological functions while resisting successful invasion by exotic species (Woodley et al., 1993).
Figure 119a illustrates the assumed direction of energy flow through abundant or dominant organisms in Otsego Lake during the 1970s. Figure 119b illustrates the current situation. Introductions of organisms during the 1980s and 1990s have, in part, resulted in the following significant changes:
1. The phytoplankton community is now commonly dominated by Oscillatoria, Fragillaria, Synedra, Melosira and Chlamydomonas (Ramsey, Unpbl.) (see "Phytoplankton" section). These genera have been cited as typical of eutrophic alkaline waters (Wetzel, 1983) in contrast to some of the historically dominant taxa, such as Dinobryon and Ceratium, typical of mesotrophic and oligotrophic waters (Harman et. al., 1980). This indicates a tendency towards increasing eutrophy.
2 . Myriophyllum spicatum, Potamogeton pectinatus, P. crispus and Heteranthera dubia are the most widespread macrophytes (Harman, 1994b). Myriophyllum spicatum and P. crispus are introductions. Between 1935 and 1993, the number of species of submergent macrophytes distributed throughout the littoral zone in Otsego Lake remained between 22 and 25. Through 1986, 4-6 species shared dominance including the macro-alga Chara vulgaris, which is noted for its intolerance to phosphorus enriched substrates (Vertucci and Harman, 1978a; b; c). In 1993, only one species, the introduced Myriophyllum spicatum, was considered abundant. It currently dominates the entire littoral macrophyte community. Many littoral areas that were formerly occupied by C. vulgaris currently have no macrophytes present. Both changes indicate increasing eutrophy as well as a loss of ecological sustainability.
3. In the late 1960s, tubificid oligochaetes were dominant in sediments from 40 to 50 m in depth, while chironomid larvae made up most of the biomass between 4 and 40 m. A diversity of arthropods dominated the littoral substrates. In 1993, tubificids were abundant from 30-50 m in depth, whereas chironomids only dominated substrates from 20-35 m. The greatest biomass in the littoral regions was made up by several species of snails and fingernail clams (Harman, 1994c) (see "Zoobenthos" section).
Alterations in the eulittoral zoo-macrobenthic community have resulted in a lake-wide reduction of species richness of 27.5%. The species richness of "pollution intolerant taxa", as represented by the Ephemeroptera (mayflies), Plecoptera (stoneflies) and Trichoptera (caddisflies), has been reduced by 56%, including the extirpation of stoneflies. The species richness of the eulittoral molluscan fauna has been reduced by 53%. Much of this loss is assumed to be attributed to changes in the level of the lake due to the renovation of a the Village dam in the early 1950 s and chronic eulittoral siltation (Harman, 1974c). Photographs from the 1920-30s illustrate a shoreline of much different character than that present today. Harman (1971b), discussing the distribution of Otsego Lake mollusks in 1969-70, mentioned the potential negative effects of increased siltation resulting from the creation of an artificial sand beach in the Hyde Bay area.
Changes in the deeper littoral regions, which have resulted in the loss of much of the Arthropod (Insect) biomass, a re assumed to be associated with decreases in the diversity of food and cover. This change presumably resulted from the reduction of macrophyte diversity due to the dominance by M. spicatum mentioned above. Changes in the distributions of the profundal fauna (oligochaetes and chironomids; see "Zoobenthos" section) correlate with recent decreases in late-summer oxygen concentrations in those areas (see "Dissolved Oxygen" section), which is a function of nutrient loading and increasing eutrophication.
4. Before 1990, the zooplankton community was dominated by large crustaceans. Concentrations far exceeded those found in the Finger Lakes to the west (Harman et. al., 1980). In recent years, the crustacean zooplankters of the limnetic zone have been dominated by small individuals of the cladoceran Bosmina and comparable numbers of cyclopoid and calanoid copepods. These, in turn, are subordinate to several taxa of rotifers which now dominate the zooplankton. Keratella and Polyartha are usually the most abundant (France and Taylor, 1994).
The drastic alterations experienced by the zooplankton community are correlated with the introduction of the alewife. This forage fish is an extremely effective predator of large crustaceans, such as Daphnia (Cladocera) and the larger copepods (Cyclopoida, Calanoidea). Historically important cisco populations have crashed, probably due to direct competition with alewives (Frost, 1993). Released from competition with the crustaceans, rotifer populations have increased rapidly (France and Taylor, 1994). Rotifers are not as effective in reducing algal populations as are crustaceans; therefore, algal standing crops have increased, contributing to turbidity and possibly causing further reduction in late summer, deep-water oxygen concentrations.
5. The fish community in Otsego Lake and its watershed, has undergone several important changes (Foster, 1996). Recent introductions include Atlantic salmon, brown trout, smelt, alewife, fathead minnow, fallfish and European rudd. American eels are declining due to barriers to migration in the Susquehanna River. Cisco, and possibly whitefish, are declining due to competitive interactions with the alewife. Emerald shiners, bridle shiners, blackchin shiners, spottail shiners, rosyface shiners, spotfin shiners and smelt, all schooling planktivores, appear to be in decline. Populations of tadpole madtoms, margined madtoms, redfin pickerel, bluegills, slimy sculpins, burbot and walleyes have declined, several drastically. The populations of white suckers are increasing, as are those of several cyprinids, including pearl dace, redbelly dace, redside dace and cutlips minnow. The above alterations in the fish community appear to be directly related to exotic introductions, most importantly the alewife, as well as increasing eutrophy and decreasing stream quality (Foster, 1996).
Populations of organisms in habitats experiencing gradually increasing eutrophy will thrive until impacted by some limiting factor (Lindeman, 1942; Andrewartha and Birch, 1964). If such factors are density independent, but trophic driven, they will cause catastrophic destruction at some increased level of productivity. Although annual fish kills in small impoundments are classic examples, deoxygenation of the hypolimnion of the central basin of Lake Erie in the 1960s clearly indicates the occurrence of this phenomenon in large bodies of water supporting cold water fisheries (Burns, 1985). Otsego lake trout populations, which currently are thriving, coupled with increasing oxygen stresses, are illustrative of a somewhat earlier stage in this scenario.
TROPHIC STATUS
The trophic status of a lake is a function of productivity, as well as how that productivity manifests itself relating to transparency, hypolimnetic dissolved oxygen levels, and the floral and faunal communities present. Productivity is dependent upon nutrient levels. Due to its high nitrogen:phosphorus ratio, phosphorus is most critical in dictating productivity in Otsego Lake. In-lake phosphorus levels are, in turn, largely dependent upon tributary water quality, which is a function of land forms and land uses.
The morphology of Otsego Lake is typical of oligotrophic bodies of water. However, highly calcareous bedrock and cultural effects provide ample nutrients, resulting in high standing crops, specific conductivity, and alkalinity values typical of more eutrophic situations. Recently observed changes include increasing total phosphorus and chlorophyll a concentrations, decreasing hypolimnetic oxygen levels prior to fall overturn, and decreasing Secchi transparencies. These are indicative of a shift toward eutrophy.
From 1935 to 1974, changing seston concentrations indicated in creasing standing crops. Similarly, chlorophyll a values suggest increasing biomass through the 1970s. Between then and 1988 algal productivity seemed to have dropped sharply (Iannuzzi, 1991a; b), coinciding with increased water clarity and a decreased hypolimnetic oxygen deficit (see below). Determinations conducted in 1993 and 1994 (Ramsey, Unpbl.) demonstrate a reversal of these improvements. A synopsis of the algal community is given in the "Phytoplankton" section. Recent trends in transparency have been highly correlated with indicators of algal biomass, an exception being in 1993 when chlorophyll a levels were higher and transparency lower than observed in 1994. This likely was due to dominance by the blue-green Oscillatoria rubescens throughout 1993, which typically favors low light conditions (Marsden, 1989) and, during stratified conditions, would likely have minimal effects upon surface clarity.
Introduced macrophytes known to become dominant in enriched waters became established in Otsego and most native species moved into shallower waters than those that they occupied in 1935 (Harman et al., 1980). Extensive beds of Charasp. have disappeared in many locations resulting in uncolonized littoral substrates. Macrophyte densities appear to have increased in recent years, though this may be an artifact due to the robust nature of the introduced, newly dominant taxa (see above).
Late summer hypolimnetic dissolved oxygen levels have decreased sharply in recent years (see Figures 30a-d; "Dissolved Oxygen" section). From 1993 to present, concentrations in bottom waters have fallen below 1 mg/l; additionally, significant strata in the upper hypolimnion have been reduced to concentrations below 5 mg/l (Figures 30b-d). Continued decreases will pose a threat to the cold water fishes of Otsego Lake. Areal hypolimnetic oxygen deficits (12 m+ depth) were computed for several years since 1969 (Table 55). Except for the relatively favorable conditions observed in 1988, values exceeded the lower limit of eutrophy suggested by Hutchinson and Mortimer (Hutchinson, 1957). In fact, the deficit of 1995 was over twice Hutchinson's limit.
Total phosphorus levels in the lake have gradually increased since data collection began, with the exception again being observed in 1988 (Table 22) (see "Plant Nutrient" section). It logically follows that increases in phosphorus loading, either internal or external, have occurred. Total phosphorus budgets derived via a two year, precipitation-based study conducted throughout 1991 and between May 1, 1992 and April 30, 1993 indicated areal total phosphorus loadings of 0.29 and 0.63 gm/m2 lake surface/year, respectively (Albright, 1996; see "Stream Flow and Quality" section). These differences were presumably due to the variability of meteorological conditions during the period of study. The measured range falls very close to previous estimates based upon empirical models.
Theoretical loading, based upon population distribution and land use throughout the watershed, and calculated according to Vollenweider's criteria (1968), equaled 0.56 gm/m2 lake surface/year in the late 1970s. Similar computations, relative to the same time period, by P. J. Godfrey (Unpubl.) using formulas developed by Oglesby (Oglesby and Schaffner, 1978), give values of 0.33 gm/m2 lake surface/year. Of the fluvial inputs, those streams draining agricultural areas delivered the greatest volume of phosphorus to the lake. However, Willow Brook, draining a largely urbanized basin, delivered the most phosphorus per unit area. Undisturbed areas were drained by streams having good water quality.
While estimated to account for only 3.5% - 7.2% of the phosphorus influx, impacts by septic fields may be substantial. Much of the phosphorus entering the lake via fluvial inputs is in forms that are not readily available to algae. Also, as the bulk of the deliver y of these inputs occur in late winter and early spring, a significant portion of this phosphorus is likely incorporated into the sediments and/or flushed from the Lake prior to the onset of the first algal blooms. In contrast, that delivered by septic fields is highly soluble and easily utilized. And, since most lakeside residences are seasonal, much of this nutrient is delivered during the height of the algal growing season.
Through 1994, regular monitoring of in-lake phosphorus concentrations had not demonstrated any incorporation of this nutrient into hypolimnetic waters from the sediments during late summer stratification. However, the most recent observations (fall, 1995) show that phosphorus levels in bottom waters gradually increased from a baseline of approximately 10 ug/l through August to 23 ug/l on October 10. Over this time interval, dissolved oxygen decreased from 3.5 mg/l to 1.1 mg/l. Such internal phosphorus release from lake sediments has been documented for many other water bodies. This phenomenon is generally associated with deoxygenation of waters overlying the sediments, resulting in a reducing environment and a subsequent release of phosphorus from manganese and iron complexes (Bostrom et. al., 1982; Hardt et. al., 1983; Kortmann, 1980; Marsden, 1989; Mawson et. al., 1983; Mortimer, 1971). Additionally, significant phosphorus release rates have been reported as oxygen levels drop below 2-3 mg/l (Mawson et. al. 1 989; Mortimer, 1971). While anoxic conditions have never been encountered in Otsego Lake, dissolved oxygen concentrations near or below 1 mg/l are routinely observed in deep waters prior to fall overturn. It is not currently known whether phosphorus liberated from the sediments persists in the water collumn following overturn and is ultimately available for algal uptake. The absence of internal hypolimnetic enrichment prior to 1995 may have been due to Otsego's oligotrophic history, resulting in a relatively high phosphorus retention capacity of the lake sediments. However, since retention capacities are limited (Marsden, 1989), any trend toward cultural eutrophication may be compounded by a decrease in the phosphorus retention capacity of the sediments.
In addition to hypolimnetic internal phosphorus loading, sediment-bound phosphorus in littoral areas is constantly suspended, deposited, and resuspended as a result of wave and wake perturbations (Harman and Lindberg, 1991; France and Albright, 1996a; b) (see "Water Movement" section). High correlations have been observed between boat traffic and near-shore turbidity, suspended inorganics, and total phosphorus (France and Albright, 1996b). Recent literature suggests that phosphorus sorbed to particulate material is potentially available to some taxa of algae (Bostrom et al., 1982; Yousef et al., 1980; Premozzi and Provini, 1985). Otsego Lake seems exceptionally susceptible to boat wakes due to its unstable eulittora l substrates. This situation is due to protection from prevailing winds by surrounding hills, resulting in less natural wave action, and to artificially high lake levels as a result of a dam renovated in the 1950s. Particulates resettle in littoral areas lakewide at the average rate of 1,807 g/m2/day. In areas more protected from the prevailing winds, such as Rat Cove, (southwestern shoreline), rates of 3,033 g/m2/day prevail. Practically all the surface wave action in the latte r area is due to powerboat traffic (see "Phytobenthos" section, Figure 74).
Various trophic state indices were developed by Carlson (1977) in an attempt to quantify the degree of eutrophy in an objective manner (Cooke et al., 1993). These indices, utilizing Secchi transparency, total phosphorus, and chlorophyll a as trophic indicators, have been applied to Otsego Lake for various years since 1972 (Table 56). (It should be noted that increments of 10 represent a doubling o f phosphorus and a halving of transparency.) The trends indicate increasing eutrophy.
When empirical management models developed by Oglesby and Schaffner (1975) and Dillon and Rigler (1974) are applied to Otsego Lake, the rather sensitive position of this body of water regarding water clarity becomes immediately apparent (Godfrey, 1977b). By expanding on the work of Oglesby and Schaffner (1975), it can be shown that the relationship between Secchi disk transparency and specific phosphorus loading in upstate New York lakes is hyperbolic. In the early 1970s, Otsego Lake fell on the rising limb of that function; therefore, even slight changes in phosphorus loading were expected to produce relatively large changes in transparency (Figure 120). Data regarding phosphorus loading and transparency collected in the early 1990s suggests that the current position on this curve has, indeed, shifted downward. The sensitivity of Otsego to moderate changes in nutrient loading are apparent when considering year-to-year variations in transparency and indices of algal biomass which are presumably due to typical meteorological fluctuations. Further illustrating this situation was a decrease in transparency and increase in algal populations following the installation of a sand filter, sanitary-waste disposal system at Glimmerglass State Park in the late 1960s, which discharged into Shadow Brook and ultimately reached the lake. Mitigation of this situation, involving the conversion to subterranean disposal in 1977, was followed by lakewide improvements. It is believed that this action, in conjunction with the state-wide, high-phosphate detergent ban in 1973, led to improved lake conditions through the 1980s.
McBride and Sanford (1996) have asserted that the trends documented herein can be attributed to normal annual variation. Their interpretation is based primarily upon an analysis of manipulated BFS Secchi transparency information collected between 1972-95. Trophic State Indices based on chlorophyll a and total phosphorus, areal hypolimnetic oxygen deficits, and extensive documentation of biotic changes which are indicative of long-term degraded environmental quality were not considered.
In order to recognize the strengths of trends in areal hypolimnetic oxygen demand (AHOD), total phosphorus (TP-P), Secchi disk transparency, and annual precipitation with time, data from 1988 to 1995 were analyzed and plotted (Figure 121). Recognizing the limitations of correlation s based on low numbers of sample points, trends are nevertheless clear. There is great variability in annual precipitation and no meaningful trend over time. Water quality indicators do show strong trends.
Correlations between precipitation and these variables (Table 57) show the weakest trends with Secchi transparency, the strongest with total phosphorus. Clear is the high correlation between AHOD and total phosphorus, illustrating the importance of the management of phosphorus to reduce AHO D, which could well become limiting to cold water fish populations in Otsego Lake. Each point plotted in Figure 121 and used to compile Table 57 represents numerous samples taken annually. Relationships between dissolved oxygen, chlorophyll a, and total phosphorus-P are further illustrated in Figures 29a-f (see "Dissolved Oxygen" section).
While appropriate interpretation of these data are necessary to ascertain the development of trends in changing water quality, in this case they pose few short-term management concerns. Phosphorus loading, from both external and internal sources, must be minimized to maintain late-summer oxygen concentrations in hypolimnetic waters adequate to support the cold water fishery. Release of phosphorus from the profundal sediments prior to fall overturn in 1995 attests to the urgency of the current situation.
Trophic indicators in Otsego Lake are intimately linked with its food web structure. Despite epilimnetic productivity bordering on t hat of mesotrophic waters in 1976, Otsego Lake exhibited a relatively low algal standing crop (see "Phytoplankton" section). As shown, the loss rates due to grazing, sedimentation, and decay were very high (Godfrey, 1977b). Epilimnetic populations in late summer, although relatively low, were dominated by large phytoplankton species much more so than most of the nearby Finger Lakes (Mills, 1975; Godfrey, 1977a). Presumably, the production of small algae was selectively reduced by zooplankton, which cannot easily forage on the existing larger algae (Porter, 1977). Comparisons of zooplankton counts for Otsego (Harman and Sohacki, 1976) in 1975 showed substantially greater cladoceran abundances in Otsego at that time than in any of the Finger Lakes (Table 35). Otsego and Skaneateles were most similar in trophic state (the other lakes were mesotrophic to eutrophic). Both cladocerans and copepods were more abundant in the 1970s in Otsego than in Skaneateles (Harman et al., 1980). At that time, Godfrey (1977b) stated that... "Otsego Lake would thus seem to have the potential for a higher algal standing crop and less transparency than currently (1973) observed, without any increase in nutrient loading". Factors that reduce the zooplankton grazing rate, such as the introduction and population irruption of the alewife, would be expected to result in greater algal standing crops.
The introduction of the alewife in 1986, and the concomitant decrease in populations of large zooplankters, has resulted in a drastic reduction in cisco populations and apparently has negatively affected whitefish, smelt, and most other planktivores (Foster, 1993; Frost, 1993). This size-selective predation (Brooks and Dobson, 1965) has had similar repercussions on other water bodies. Cooke et al. (1993) present several case studies describing the effects of top-down interactions between predators and zooplankton and phytoplankton communities. In addition to direct competition for food resources, various fishes may be suffering declines as a result of alewives foraging upon their eggs and fry. Populations of both coregonids showed signs of stress in the early 1990s (Keenen and Ketola, 1993). In 1995, several cisco and whitefish have been observed that appear healthy, possibly indicating some stabilization of their populations at reduced levels. Lake trout and Atlantic salmon have exhibited excellent growth since alewife populations increased (Sanford, 1994).
Because of a lack of current data on alewife populations, their impact on nutrient cycling and availability cannot be ascertained. Alewife introduction and irruption has been concurrent with increasing symptoms of eutrophy thus complicating the relationships between internal and external loading. Summer algal standing crops have increased. It is assumed that reduced grazing by zooplankton leads to an increased rate of sedimentation of algal cells to profundal waters where respiration and decomposition depress dissolved oxygen concentrations. In theory, restoration of historic populations and species composition of crustacean zooplankton through increased piscivory should decrease algal standing crop, increase clarity, and help minimize hypolimnetic oxygen deficits. While such protocols have been successfully implemented in other lake management plans (Cooke et al., 1993), DEC Finger Lake fisheries managers with on-going salmonid stocking programs similar to one proposed for Otsego reported no noticeable decline in a lewife abundance (Mcbride and Sanford 1996). Lacking the alternative of alewife control, reducing phosphorus loading seems to be the only viable option to maintain Otsego's current conditions.
The delicacy of the Otsego Lake ecosystem requires special emphasis. The above mentioned changes which have resulted from nutrient loading, both internal and external, and introductions of exotic organisms, have impacted those ecosystem characteristics most valuable to society in a way that seems to have been disproportionally large.
The data acquisition necessary for the development of this contribution was the first step in the process of designing and implementing a management plan for the Otsego Lake watershed. The second, now ongoing, is to gather information regarding citizen concerns, perceptions and agendas about this resource. Without the latter input, the political will to support any plan would be lacking and the effort would surely languish without timely and effective implementation.
Information gathering from the citizenry also provides the socio-political attributes to the ecosystem scenario, such as safety and aesthetic values, that are paramount to any planning effort but are beyond the scope of this report.
A majority of the changes most seriously affecting the recreational use of Otsego Lake over the last 30 years have been the direct result of introductions of exotic organisms. From an ecological perspective, Otsego Lake is not the lake it was even 20 years ago, and it is very unlikely to return to those conditions. Change is a characteristic of inland bodies of water. And the introductions causing some changes are not always negative. But chronic attacks by one invading species after another precludes even the ephemeral stability necessary to maintain an ecosystem's integrity and sustainability (Woodley et al., 1993). These changes compromise the characteristics that enable the resource to remain an asset to the community, both ecologically and economically.
There are several species of exotics in New York State waters that are serious pests that have not yet appeared in Otsego Lake. More will continue to invade the State as commercial and recreational activities increase their motility. It is important that any management plan include recommendations for measures to reduce the probability of successful colonization into Otsego by these organisms.
An even more important component of any management strategy to ensure the present viability of this resource is to implement means to reduce phosphorus loading and availability. The data presented in this report not only document an enhanced rate of eutrophication, but reveal a situation that pleads for timely and effective action.
There are indications that a feed-back phenomenon has been initiated that can rapidly increase the rate of internal phosphorus loading. There are increasing hypolimnetic oxygen deficits, most manifested in decreased late summer, deep water dissolved oxygen concentrations. Concurrently, there has been a recent (1995) increase in total phosphorus in bottom waters derived from sediments during late summer stratification. Sediment-bound phosphorus can be released into hypolimnetic waters during periods of anoxic or near anoxic conditions. Following overturn, it is made available to organisms. Increases due to internal loading can be extensive enough to render ineffective comparatively inexpensive, normally recommended non-point source pollution strategies to minimize in-lake availability of phosphorus (Bostrom et al., 1982; Carr, 1962; Cooke et al., 1993; Cullen and Forsberg, 1988; Sas et al., 1989). These include land use regulations including provisions for nutrient management, agricultural "Best Management Practices" and recreational use legislation. We assume that there is still an opportunity to reverse this trend. However, it is not known how long it will take for conditions to deteriorate to the point where conventional watershed-oriented mitigation is ineffective.
Aside from the ecological impacts of increasing eutrophication, the importance of protecting Otsego Lake's quality is paramount with regard to it being the primary potable water source for the Village of Cooperstown and many lakeside residences. Eutrophic conditions not only impart undesirable tastes, odors, and colors to water, but associated organic molecules may react with chlorine during disinfection processes to form potentially carcinogenic or mutagenic trihalomethanes (Cooke et al., 1993). Additionally, there is evidence of gastrointestinal disorders related to the consumption of water derived from surface sources experiencing blooms of blue-green algae, which often are associated with increasing eutrophy (Carmichael, 1985). Increased operating and maintenance costs by water treatment facilities necessary to manage the above problems are significant.
If Otsego Lake is to retain the characteristics that have made it the environmental and cultural focus of human endeavor in our region, it is imperative that existing phosphorus sources, as well as those resulting from actions that could increase its loading or availability, be aggressively mitigated.
View a PDF of all references cited in The State of Otsego Lake, 1936-1996

