Overview
Many Earth processes are difficult to understand because of their complexity or because of their large spatial and/or temporal scales. Dynamic models that represent Earth processes and scale models that show spatial relationships can greatly aid students in understanding many concepts in Earth Science. This website presents models that were developed by pre-service teachers (undergraduate students) during three summer Earth Science Model Research and Design Institutes (2017-2019) funded by the National Science Foundation. In addition, other models developed by pre-service and in-service teachers are also presented.
Contacts
James R. Ebert
Distinguished Teaching Professor
Department of Earth and Atmospheric Sciences
Room 212 Janet R. Perna Science Building
SUNY Oneonta
108 Ravine Parkway
Oneonta, New York 13820
E-mail: James.Ebert@oneonta.edu
Phone: 607-436-3065
Paul Bischoff
Chair
Secondary Education and Educational Technology Department
374E Fitzelle Hall
SUNY Oneonta
108 Ravine Parkway
Oneonta, New York 13820
E-mail: Paul.Bischoff@oneonta.edu
Phone: 607-436-2613
Glenn Dolphin
Tamaratt Teaching Professor
Department of Geoscience
University of Calgary
2500 University Drive NW
Calgary, Alberta T2N 1N4
E-mail: Glenn.Dolphin@ucalgary.ca
Phone: 403-220-6025
Models
Atmosphere to Scale
Overview on how to build your own scale model of the atmosphere.
What you’ll need:
- One standard 12-inch classroom globe
- Two pack of size 4XL non-control top panty hose
- 2 yards of a blanket-like fabric approximately 0.6cm thick
- Needle and thread
- One yard of 1" wide elastic
- Two D rings
- Yarn
- Small safety pins
- Digital Caliper
What to measure:
To ensure that the model is truly to scale use any sensitive measuring device (digital caliper) to find flexible materials that when stretched over the globe will equate to the true scale of Earth’s atmosphere if applied to the globe’s size.
The measurements are as follows:
Earth’s Diameter: 12,742 km
Globe’s Diameter:30.39 cm
Height of Atmosphere: 700km
Equation used: 30.39cm = x
12,742 km 700km
X=1.67cm
We used the same equation to find the thickness of the separate layers of the atmosphere as well
How to construct:
Starting with a standard globe first remove the pin or screw holding the globe to the metal stand. Once the pin is removed you will be able to take the globe off of the metal frame. Once you have found proper materials to represent the two layers of the atmosphere we will be representing. For us that will be the size 4XL non-control top panty hose, and the blanket-like fabric approximately 0.6cm thick when stretched. To create the round layers to fit around the globe take the pantyhose and sew one end shut using fine sewing thread leaving a hole at the top where the globe can be reattached to the metal frame. To tighten the bottom of the pantyhose thread a piece of yarn through the band to allow for the size to be adjusted when removing the layer. Next take the thick fabric and create a similar sized case as the pantyhose. For this use the sewing thread again to tighten the top portion leaving a hole to reattach the globe to the frame, and sine this material is so much heavier use a thick piece of elastic threaded through the other side to tighten over the globe. To secure the elastic and keep the material taught use a set of D rings to tighten and relax the elastic band. Once the two outer layers are completed fit the first layer on and using the hole on the globe above the Arctic as a guide for orientation, once the first layer is on the second can fit over the globe, make sure to keep orientation in mind. Once done you can use a screw or long nail to reattach the globe to its metal frame and begin using the model!
Directions for Building Scale Model of Atmosphere
Grade Level: 8th-9th
Lesson Goals
Central Focus of Lesson:
The central focus of this lesson is the layers of the atmosphere and their true sizes relative to one another and to the true size of the Earth.
Standard(s) Addressed:
MS-ESS1-3. Analyze and interpret data to determine scale properties of objects in the solar system. [Clarification Statement: Emphasis is on the analysis of data from Earth-based instruments, space-based telescopes, and spacecraft to determine similarities and differences among solar system objects. Examples of scale properties include the sizes of an object’s layers (such as crust and atmosphere), surface features (such as volcanoes), and orbital radius. Examples of data include statistical information, drawings and photographs, and models.] [Assessment Boundary: Assessment does not include recalling facts about properties of the planets and other solar system bodies.]
WHST.6-8.2 Write informative/explanatory texts to examine a topic and convey ideas, concepts, and information through the selection, organization, and analysis of relevant content.
6.RP.A.1 Understand the concept of a ratio and use ratio language to describe a ratio relationship between two quantities. (MS-ESS1-1),(MS-ESS1-2),(MS-ESS1-3)
7.RP.A.2 Recognize and represent proportional relationships between quantities. (MS-ESS1-1),(MS-ESS1-2),(MS-ESS1-3)
Lesson Objectives and Demands
Content Objectives:
SWBAT analyze and interpret data to determine scale properties of the layers of the atmosphere.
SWBAT recognize and represent proportional relationship between quantities
Language Objectives:
SWBAT understand the concept of a ratio and use ratio language to describe a ratio relationship between two quantities.
SWBAT write informative/explanatory texts to examine a topic and convey ideas, concepts, and information through the selection, organization, and analysis of relevant content.
Key Vocabulary in Lesson:
Troposphere, Tropopause, Stratosphere, Stratopause, Mesosphere, Mesopause, Thermosphere
Lesson Considerations
Materials:
- One standard 12-inch classroom globe
- Two pack of size 4XL non-control top panty hose
- 2 yards of a blanket-like fabric approximately 0.6cm thick
- Needle and thread
- One yard of 1" wide elastic
- Two D rings
- Yarn
- Small safety pins
- Elmer's glue
- Construction paper
- Digital Caliper
- Ruler
- Box (30.39 cm)
- Milk carton (9.71 cm)
- 5 index cards glued together (0.095 cm)
- Box of matches (12 cm)
- Wax paper (0.004 cm)
- Produce bag from supermarket (0.001 cm)
Prior Academic Learning and Prerequisite Skills:
In this lesson, students will need a general understanding of ratios, which they will have learned about in math class.
Misconceptions:
- The most common misconception about the atmosphere is its thickness. Most students think that it is much thicker than it actually is. By allowing students to compare the actual thickness of the atmosphere to other more concrete distances they will have a revised, more accurate mental model of the layers of the atmosphere.
- In most diagrams found online and in textbooks, the layers of the atmosphere appear to all be around the same thickness, when in actuality the troposphere is significantly thinner than the stratosphere and mesosphere, and the thermosphere is significantly larger than the other layers. With diagrams that are actually to scale, we will be able to dispel this misconception.
Lesson Plan Details
Lesson Introduction - “Before”:
Students will begin the class period by participating in the hands-on activity that will consist of comparing different sized objects to the globe and deciding which they think is the true thickness of the atmosphere. With their heads down so they can't see what their peers pick, students will raise their hands, voting on which material they think is the true height of the atmosphere.
Learning Activities - “During”:
- Students will be placed into groups and assigned a layer of the atmosphere to research. They will be able to use the internet and textbooks. They will write the information that they deem most important and relevant on their section of the handout. Once all groups have completed their layer, a member of each group will come up to the board and write their information.
- Once all the information has been compiled, the students will once again vote on which material represents the true height of the atmosphere. Once all the votes are taken, the teacher will reveal to the students which material really represents the atmosphere and what distances the other materials represent.
- The cross section of the troposphere, stratosphere, and mesosphere will then be used to show students their relative thickness. The model, with the layer of panty hose and the layer of the blanket material, will show students the flexibility and porosity relating to the intake and output of radiation and also give students an idea of how fragile and thin the troposphere is.
Closure - “After”:
To check for understanding, the students will write a short response. They will include what materials they thought were the height of the atmosphere before and after their research. They will also include what they found to be most surprising, whether from the activity, model, or their research.
Extension:
An extension for this lesson would be a small introduction into the ozone layer, which can be found in the lower stratosphere, and human's impact on the atmosphere.
Lesson Plan Appendix and Commentary Section
Assessment Strategy #1: Informal
Jigsaw activity: Students will be placed into groups and asked to research an assigned layer of the atmosphere and fill out that section of the handout. They will then compile their data on the board.
Alignment with Objectives:
Students will research the different layers of the atmosphere and pick out the most important and relevant information on each.
Students will analyze and interpret data to determine scale properties of the layers of the atmosphere.
Evidence of Student Understanding:
If students are able to pick out the most important information on each layer and share this information with their peers.
Student Feedback:
Verbal feedback will be given to students after all the groups have contributed their findings to the diagram on the board.
Assessment Strategy #2: Formal
Once they have completed the jigsaw activity and learned what each of the objects represented, students will write a short response.
Alignment with Objectives:
Students will recognize and represent proportional relationship between quantities.
Students will understand the concept of a ratio and use ratio language to describe a ratio relationship between two quantities
Evidence of Student Understanding:
If students can make comparisons between the different materials and the layers of the atmosphere, integrating proportions and ratios.
Student Feedback:
Feedback will be given to students in the form of written comments on their writing assignment.
.
Utilizing Knowledge about Students to Plan and Implement Effective Instruction
Grouping Strategies:
Students will be placed into randomly selected groups for the research activity.
Planned Supports:
• Provide data chart for students with disabilities.
• Provide in PowerPoint translation of new vocabulary words into emergent bilingual students' home language, and dictionary in home language.
• For the assessment for the writing piece, allow emergent bilinguals to create drafts and outlines in home language when appropriate provide translation software for easier typing.
• For students with disabilities, extra time and additional meetings with teacher when planning out final writing assignment.
• Consult the school's special education writing expert or have the special education teacher come in and work with the student(s).
• For emergent bilinguals, if rubric includes grammatical grades, shift accordingly to school or stand test found English level.
Acknowledgements
Sources:
https://ncar.ucar.edu/home
Atmosphere to Scale Model Video
Greenhouse Gases
Project Credit: Brian Murphy, Carlie Perretta
The Reverse Kerplunk Greenhouse Effect Model Materials
Lasko 20” box fan
- Red Offray Ribbon ⅜ in x 18 ft
- ~20 wooden dowels 1/12 in diameter.
- ~55 oz plastic container ~ 20 cm tall.
- Blue, yellow and black markers.
- Wooden dowel ~ 1 inch in Diameter
- Wooden platform ~4 x 8 in
- 3 1 inch diameter dowels
- 3 sliders for dowels
Procedure to build
- Take a plastic container, in our case we used an old pretzel container, and cut off the top and the bottom of the container. The circumference of the top and bottom of the container should be equal and the cylinder should stand now around 20 cm tall.
- Cut holes on opposing sides of the container so that you can skewer the wooden dowels through the container. The holes work best if they are cut through the upper third of the container. Not all dowels have to pass through the middle of the container with enough of them in they should create a blanket of sorts.
- Cut the ribbons to a length of around 12 inches and tie them to the fan in a position where they will blow up in the wind easily at the highest setting. We found it works best to tie them around 5 inches from the center of the fan. We used 6 ribbons and tied them in a cluster so that they took up the space of the container.
- Color the wooden dowels so that ~ ⅔ of them are blue and black, blue representing is Hydrogen and black is oxygen and so that they alternate to make a water molecule. The other ⅓ should be colored yellow and black black still representing oxygen and yellow representing carbon these will be CO2 molecules.
- Place the plastic container with varying amounts of dowels over the blowing ribbons in the fan to represent infrared red light being re radiated by differing amounts of greenhouse gasses in the atmosphere.
- This procedure is now how we built a separate component of our model. This portion describes a manipulatable scale we used. We used the 3 ~1 inch diameter wood dowels and mount them on the wood platform that you can manipulate the sliders to represent differing amounts of Carbon dioxide, water and temperature of the atmosphere.
Next Generation Science Standards and learning outcomes
- HS- ESS 2-4 Use a model to describe how variations in the flow of energy into and out of Earths System results in a change in climate.
- HS - ESS 3-5 Analyze geoscience data and the results from global climate models to make an evidence-based forecast on the current rate of current rate of global or regional climate change and associated future impact on Earth's systems
- HS- ESS 3-6 Use a computational representation to illustrate the relationships among Earth systems and how these relationships are being modified due to human activity.
- By using a model students will be able to see a cause and effect relationship between the increasing human population and our increased burning of fossil fuels and the increasing amount of carbon dioxide in the atmosphere.
- Using the model students will also see the effect of an increase in the abundance of carbon in the atmosphere and the increased amount of infrared radiation that is being re radiated.
- Students will also see the cause and effect relationship between the increased temperature in the atmosphere and the increased amount of water vapor in the atmosphere.
Lesson
- Tie in molecular models of common atmospheric components, such as Water, Carbon Dioxide, Nitrogen, Oxygen, etc. and demonstrate why some of effective greenhouse gasses and why some are not.
- While demonstrating the model have visuals of cities through time and show how as populations and industries increase there is an increase in carbon production. We used a video of NYC from the 1500s to the present. https://www.youtube.com/watch?v=qEqCsJmAe6c
Iterative process of development
We started with the question of what is it about the CO2 molecule and other greenhouse gasses that cause the Earth’s climate to change.
- We searched the web and came to https://www.ucar.edu/learn/1_3_1.htm and saw a model of a carbon dioxide molecule bending and bouncing infrared radiation off of it and related this to looking like a pinball machine.
- Once we had this notion of infrared light bouncing off and re-radiating off of CO2 molecules we wanted to develop a model that allowed us to tinker with amount of greenhouse gasses in the atmosphere and show what effect that could have on temperature.
- Our idea for modeling this was to use a pretzel barrel and create a reverse kerplunk-esque game where a varying amount of skewers through the barrel would trap more or less infrared radiation.
- We first tried varying sizes of scrap pieces of paper which made a mess and got everywhere and often got trapped in the fan.
- Next we tried string which we tied to the fan but the string was too heavy and there was not enough surface area for the wind to blow it upwards.
- Finally we tried ribbons which were light enough and sturdy enough to blow nicely in the wind.
- After testing the model we wanted it to show more than just the red blowing ribbons so we created a thermometer to represent the increasing temperature.
- We then decided that it would be nice to have three different gauges representing our three main variables in the experiment.
Strengths
This model shows the relationship between carbon dioxide, water vapor and temperature through the use of three “thermometers” that are manipulatable dependent on the amount of carbon dioxide in the atmosphere. The four different components of this model allows for the students to have a better understanding of what is going in three different settings. The video of New York City over time allows the students to observe the changes that were made to NYC as more people settled there. The kerplunk-esque model shows that the more buildings that were built, the more carbon dioxide is in the atmosphere which causes an increase in temperature, which allows the atmosphere to hold more water vapor. The model’s simplicity allows for it to be easily manipulated and the target can be seen and understood without too much prior knowledge.
Limitations
- Our model does not show the heating of the earth that then causes the long wave radiation to be emitted from the earth in the form of heat energy.
- The reason for why carbon dioxide and water trap heat is not touched upon, only that adding more of it will result in a change.
- The ribbons don’t always behave as they should and will sometimes show too much heat being trapped for low amounts of carbon and not a lot of heat being trapped for high amounts of carbon.
Model Evaluation
- Relatedness- There are not many models that are related to ours. This model can be used in conjunction with molecular models that explain the structure of carbon dioxide molecules and water molecules and how they react to infrared radiation. Visual models also show the path of both infrared and visible light through the atmosphere, this can also be used alongside our model.
- Transparency- The models target was to show how varying amounts of carbon in the atmosphere affected the temperature. This model does does this fairly well. By observing how freely the ribbons can escape the container students can infer that more carbon will trap more heat. The ribbons sometimes get caught for a while which represents how it takes a while for carbon dioxide to escape the atmosphere once it is trapped.
- Robustness- Students will have to make very little assumptions while looking at this model. The only assumption that they will have to make is where the radiation is originating from because we do not have a source. The students will have to assume that the sun is giving off radiation which is then heating the earth causing the earth to give off long wave radiation.
- Fertility- The model is fertile in that it shows the relationships between human activity and carbon production and then also shows the relationships between carbon in the atmosphere and temperature.
- Ease of Enrichment- There is not much that can be done to expand upon the model.
Resources
https://www.youtube.com/watch?v=qEqCsJmAe6c
https://www.nasa.gov/topics/earth/features/vapor_warming.html
https://www.ucar.edu/learn/1_3_1.htm
Greenhouse Gases Model Video
Lunar Phases and Eclipses
Project Credit: Brian Murphy, Haley Mooney, Chrissy Scaglione
Solar Eclipse Model
Standards:
- MS-ESS1-1. Develop and use a model of the Earth-Sun-moon system to describe the cyclic patterns of lunar phases, eclipses of the Sun and moon, and seasons.
- HS-ESS1-7. Construct an explanation using evidence to support the claim that the phases of the moon, eclipses, tides and seasons change cyclically.
- HS-ESS1-4. Use mathematical or computational representations to predict the motion of orbiting objects in the solar system.
Materials:
- 6 in. diameter hard styrofoam ball
- 2 in. diameter hard styrofoam ball
- .5 in. diameter hard styrofoam ball
- circular wood platform ~60cm radius
- Wood plank 100cm x 6 cm
- 2 wooden skewers 1/12in diameter
- Wooden rod ⅝ in diameter 18cm tall
- Wooden rod ⅛ in diameter 18cm tall
- Plastic pinning stick
- Paper
- Black Chalkboard Spray paint
- Chalk
- Small Flashlight (skywolfeye tly-650)
Procedure to build model
Platform
- Find the midpoint of your platform and drill a ⅝ hole there.
- Spray paint the board black preferably using chalkboard spray paint.
- Using a protractor segment your board into 12 sections by drawing equidistant lines 30 degrees apart.
- Label each segment with the different months of the year.
Earth
- Use the 2 in diameter ball to represent Earth.
- Drill 1 hole all the way through the Earth at a 0 degree angle and drill another hole all the way through at a 5 degree angle. This will create a 5 degree plane around the Earth at which the moon can orbit.
- Skewer the Earth using the two 1/12th in diameter skewers.
- Pin the plastic pinner at a 23.5 degree angle to emulate the Earth's tilt on its axis, attach a star to the end of it labeled polaris for a reference point.
- Using paper, cut out a circular orbit ~.5 in wide to show the entire lunar orbit.
Sun
- Drill a ⅝ in. in the bottom to mount on the board.
- Drill a hole big enough to house the flashlight.
Plank
- Cut down a plank to ~1m long.
- Drill a ⅝ inch hole on one end and a ⅛ inch hole on the other side to mount the wooden dowels with the sun and the moon on them.
- The sun dowel does not need to be glued in place, we left it so it can be taken apart and stored more easily.
What it represents
- The relationships between the sun, moon and earth in the solar system.
- The mathematical relationships between the sun moon and the earth relative to the ecliptic plane.
- This model shows the moon's 5 degree orbital plane and how at different times it will be either above and below the ecliptic plane preventing there from being an eclipse.
- The model shows the earth’s 23.5 degree tilt relative to the ecliptic plane.
- Why eclipses don't happen every month and the conditions needed for an eclipse to occur.
- How Earth's 23.5 degree tilt on its axis causes seasons the seasons occur.
- How the moon's orientation can lead to partial and total solar eclipses in different areas.
Iterative nature of model development
- The first question we sought to answer was why there were not eclipses every month, many models we were exposed to led us to this assumption.
- Our first resource to finding the answer was in a high school Earth Science textbook, this gave us some information. We also searched the internet and worked towards a better understanding. Using existing models also allowed us to question what was missing in what we didn’t understand. Once Dr. Nollenberg explained to us the moon's orbit it gave us enough concrete information where we then understood the concept enough to learn more about.
- We discovered that the moon's orbital plane is on an inclination of 5 degrees relative to the ecliptic plane and decided that modeling this 5 degree tilt would be worthwhile.
- Our first attempt at modeling this was unsuccessful, we created a track around a globe and discovered the scaling of it would not allow us to highlight what we wanted. Since the globe was too big and the track was too small the moon was always in a position where there would be an eclipse on Earth. The plane around the globe was also not easily manipulatable.
- We then decided to scale down our model so that the Earth was smaller and the plane was larger. This more clearly showed that the moon was well above and below the Earth. Our problem now was trying to revolve our Earth around a sun since we didn’t have a reference point. We solved this by starting to develop a platform to position the Sun Moon and Earth in a system.
- As we developed the model we stopped at each point in time and tested it, in testing it we found weaknesses that we then later addressed.
Our Research
- Earth Science textbook introduced the topics of our model.
- NASA’s website explained moon, earth, sun relationships.
- An outside consultant, Dr. Nollenberg, shared with us his knowledge on astronomy and how the moon orbits.
- The Planetarium provided valuable insight on the Earth and space perspectives of the moon’s orbit and how it operates in relation to the Earth and Sun.
Model Assessment
- Relatedness- the model fits well with other 2D and 3D representations of our target and can be worked together with them to create a more complete understanding of the topic. Other models are listed below.
- Transparency- The models target was to explain why eclipses occur when the do and the reasons as to why. By shining a flashlight at the Earth and moon at different times it is very visible when eclipses do and don't occur and that the reason is because of the moon's orbital plane being tilted. The model explains the target well.
- Robustness- Assumptions to be made about the model is that it is at a smaller scale than the actual solar system.
- Fertility- The model has good fertility, it can be used to explain a variety of things about the target. The model shows very clearly why there is an eclipse and why there is not and explains it by allowing the students to see the 5 degree tilt of the moon’s orbital axis.
- Ease of enrichment- Great ease of enrichment, the model has room to add on and extend. The models initial purpose was to show Sun Moon and Earth relations and eclipses but was extended to explain seasons, phases of the moon and other aspects of the solar system. This model can be used in a number of ways.
Strengths and Weaknesses of the model
The model doesn't show any other planets besides earth, hiding other planets in the solar system allows us to focus on just the Sun, Moon, Earth relationships. The process in which an eclipse can occur is highlighted in the model and does this well. The model demonstrates that the moon and earth have to be aligned with the sun at the 0 degree ecliptic plane for an eclipse to occur, other models or description may be needed though for a complete understanding of the ecliptic plane. The model allows students to see monthly and yearly cycles of both the moons and suns orbit and allows them to manipulate it. The model is versatile and since it can be used to show several different processes the model can be used throughout the year which can allow students to gain a familiarity for the model.
Similar Models
- The American Educational Orbiter shows the Sun, Earth, Moon relationships, however it fails to properly represent the moon’s tilted orbit and in doing so, creates monthly eclipses. Our model focuses on the moon’s 5 degree orbital plane that explains why we don’t have eclipses every month.
- The Phases of the Moon Model shows what the moon appears to look like from Earth during its monthly path, however it fails to show how the moon’s 5 degree orbital tilt causes less eclipses than what this model shows, which is monthly.
- Moon Eclipse Models show the 2D alignment of the Sun, Earth and Moon, or Sun, Moon and Earth, however it lacks the ability to show how the Moon orbits around the Earth monthly and yearly, and why we don’t experience eclipses monthly.
- Handheld Lunar Phases Model shows the different phases of the moon as students hold a styrofoam moon on a stick and spin it around themselves with a fixed Sun. This very well shows the phases of the moon, however when it comes to the new moon and full moon, some could say that they experience eclipses. It fails to properly show the moon’s orbit and leads to the belief eclipses may happen every month.
Lunar Phases and Eclipse Model Video
Retrograde Motion
Subject: Earth Science
Grade level: 9th/10th grade
Title of Unit: Retrograde Motion
Objectives
- Explain Astronomical events that changed humans' view of earths place in space.
- Describe how Mars retrograde motion supports the heliocentric model
Information/Content to be covered
Be brief, a bulleted list of the big items is fine
- Ancient Greeks and the early beginnings of astronomy.
- Geocentric and Heliocentric models
- Ptolemaic system
- Nicolaus Copernicus
- Mars retrograde
Literacy (NYESED Next Generation Standards)
- Earth and celestial phenomena can be described by principles of relative motion and perspective(HS-ESS1-7)
We will meet these standards by using a jigsaw method in class exploring early astronomy. On day 2 students will be able to see and plot Mars retrograde motion using a model. Using the information, they have learned they will be able to complete a RAFT activity.
Materials Needed
Earth science text book with chapter on Earth's place in space.
Mars Retrograde model
Paper and pencil
Graphic Organizer
Articles
2 threaded rods 11/64"
1" PVC pipe
1 ¼" PVC pipe
2 Bottle Caps
2 Styrofoam planets
Balsa wood
Hot Glue
Wood-for base
Cordless drill with 11/64" drill bit and 1" drill bit
Block of wood
Handsaw
Laser
Tape for laser
Cardboard and printed paper
Scissors
Clamp
Measuring Tape
Literacy Activity and Procedures
Day 1
Pre-reading: For Jigsaw method:
- Students are broken up into 4 groups
- Students given 5 minutes to read section of textbook assigned to their number
- Students fill out graphic organizer and sketch model for their reading
- Students go back to original groups and share what they have read with other students
Day 2
- Activate prior knowledge: ask students to diagram their understanding of the solar system
- Show retrograde motion simulation: Have students work in groups to explain, using their earlier models, how this happens
- Demonstrate model: demonstrate how planetary motion creates the illusion of retrograde motion with physical model
- Revise Models: have groups reevaluate and revise their original models and make a poster of final model
- Assign Raft Homework
Assessment
RAFT activity: Students will take the role of Copernicus lawyer to defend his theory in court. Audience is the judge, Format is a mock trial/presentation of his Heliocentric explanation of Retrograde motion to a panel of religious decision makers, and topic is heliocentrism and retrograde motion to back theory.
Adaptations and Plans for students with diverse needs
- Modifications can include extended reading time and articles that match students reading level.
- Dictionary of home language to English provided to student for reading.
Copies of Completed Activity, Guides, Rubrics used for Assessment
Writing Assessment
1. Introduction: A RAFT project is one in which you select the Role, Audience, Format, and Topic of your project. You will each individually complete a RAFT project for this assignment, based on the research done to complete your graphic organizers and retrograde models. You may receive assistance from classmates in completing technical elements, but the final project must be your design, ideas, and work. You will take on the role Copernicus' lawyer and defend his view of heliocentrism to the church court. The format of your writing should be in the form of a letter and the topic should be focused on heliocentrism and retrograde motion as supporting evidence.
Example Writing Format:
Dear Church,
[Body of letter]
From,
Copernicus' Lawyer
|
|
0 |
1 |
2 |
3 |
4 |
|---|---|---|---|---|---|
|
Role |
The author has no role |
The author has a role, but it is not clear in presentation |
The author’s role is clear, but does not provide perspective |
The author’s role is evident, but not fully exploited in presentation |
The author’s role is evident in their presentation of material, and is used to provide a unique perspective on the topic |
|
Audience |
There is no clear audience for this presentation |
The audience is not considered, or their interests are not addressed |
The audience is not fully considered, or their interests are not well addressed |
The audience is considered in the presentation, and their interests are mostly addressed |
The audience is considered in all aspects of the project, and their interests are directly addressed by the presentation of information |
|
Format |
The format is not appropriate for audience or topic |
The format is not ideal, and is used poorly in presentation |
The format is not ideal for audience or topic, or the features of the format are not considered in presentation |
The format is appropriate for the audience and topic, but is not fully exploited |
The format is appropriate for the audience and topic, and is used interestingly to provide information on the topic |
|
Topic |
The topic is not of interest to the audience |
The topic is of interest to the audience, but is not presented clearly/in an organized manner |
The topic is of interest to the audience, but the level of detail is not appropriate for audience and/or the presentation of topic is unclear or lacks organization |
The topic is of interest to the audience, the level of detail is partially appropriate, and the topic is presented clearly with organization evident |
The topic is of interest to the audience, and appropriate for the role of the author and the format of the presentation. The topic is presented in an organized and clear manner, with a level of detail appropriate to the audience |
|
Incorporation of Mars retrograde and heliocentric model |
Mars retrograde and heliocentric model issues are not included |
Mars retrograde and heliocentric model issues identified are not explained |
Mars retrograde and heliocentric model issues are included, but there are some errors (1-2) in their explanation |
Mars retrograde and heliocentric model issues are included and explained, with few errors, and with connections made to topic. |
The project clearly and concisely incorporates the Mars retrograde and heliocentric model involved into the presentation |
|
Mechanics |
Citations are missing |
Citations are incomplete Serious issues with grammar and style |
Citations are present but contain errors. Significant errors in grammar or style (3+) |
Citations are present and correct, and there are minimal errors in grammar or style (no more than 3) |
Citations are present and correct, there are no errors in grammar or style that detract from the presentation |
Retrograde Motion Concrete Dynamic-Model Video
Needs to be added to YouTube
Rift Valley
Subject: Earth Science
Grade level:9th/10th grade
Title of Unit: Rift Valley
Objectives
- Students will understand how the rift valley forms and the mechanics behind it.
- Explore the importance and impact that the African rift Valley has had to global history.
Information/Content to be covered
- Formation of Rift Valley
- Plate tectonics
- African Rift valley
- Early humans and impacts on human life
Literacy (NYESED Next Generation Standards)
HS-ESS2-1. Develop a model to illustrate how Earth's internal and surface processes operate at different spatial and temporal scales to form continental and ocean-floor features.
ESS2.B: Plate Tectonics and Large-Scale System Interactions:
- Plate tectonics is the unifying theory that explains the past and current movements of the rocks at Earth's surface and provides a framework for understanding its geologic history.
- Plate movements are responsible for most continental and ocean-floor features and for the distribution of most rocks and minerals within Earth's crust.
ESS2.B: Plate Tectonics and Large-Scale System Interactions
1)Residual heat from Earth's formation and the radioactive decay of unstable isotopes in Earth's interior continually generate energy that is absorbed by Earth's mantle and crust, driving mantle convection. Plate Tectonics can be viewed as surface expression of mantle convection.
- We will be meeting these standards by having students do research in a Think Pair share format. They will then observe the phenomenon of rifting through our developed model that demonstrates the way internal convection drives the stretching of rocks. They will then have a writing activity.
Materials Needed
- Rift Valley Model (Instructions attached)
- Video: The Great Rift Discovery Atlas
- Video Guide worksheets for every student
Literacy Activity and Procedures
Day 1: Pre-reading: Think-Pair-Share:
- Students are prompted to do research on Rift valleys. This can be done with a text book or laptop. Students will be using this Inquiry Chart to guide their research.
- They will then pair up with another peer and share their discoveries.
- Students will then come back together and will go around the classroom until all students have said something about what they have found.
Day 2:Model and Video
- Teacher introduction of Rift Valley Model followed by a class discussion of what was observed.
- After the class has gone over the process they will watch the short film "The Great Rift Valley" and follow along with the video guide.
- Using the worksheet as a guide, they will write a paragraph purposing how they think the world would be different of the African rift did not exist.
Assessment
We have a formative assessment which is a worksheet that the students will be filling out as they watch the Great Rift video.
Our summative assessment is a writing assignment where the students are to write about how they think the world would be if the African Rift didn’t exist.
Adaptations and Plans for students with diverse needs
Modifications can include extended reading time and articles that match students reading level.
Dictionary of home language to English provided to student for reading.
Instructions for model building
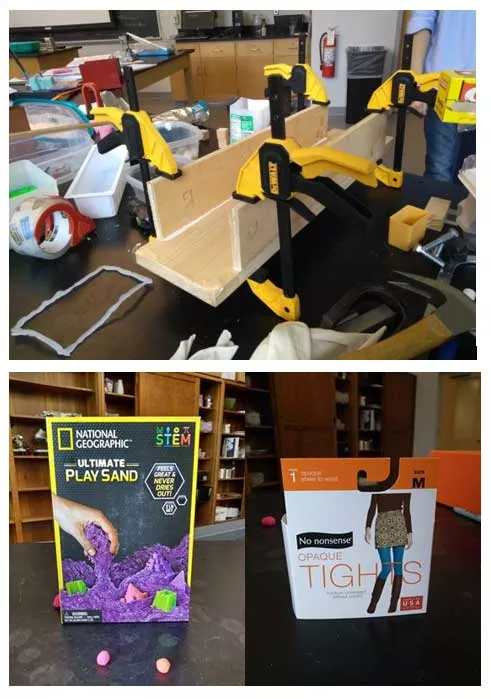
What you need
- 3 Wood Boards (23''x6'') (Cardboard or shoe box can be could be used as alternatives)
- Gorilla Wood Glue
- 1 Package of No Nonsense Opaque Sheer to Waist Tights, Size Medium.
- 2lb Box of National Geographic Kinetic Sand
- Glad Storage Container (Link to Container Used)
- Small Nails
- 4 Wood Working Clamps
- Scotch Heavy Duty Shipping Tape
Set-up
- Create a base using 3 Wood boards (23''x6'') and use wood glue to glue the three boards together, use clamps to hold the boards together as they dry. (Please see picture below to know how to glue it together)
- Apply Scotch heavy-duty shipping tape to each of the far ends of the top board. This is to prevent the tights from tearing against the wood board.
- Print out two cross-sectional views of the mantle. (Link to cross-sectional view)
- Cut out two pieces of plexiglass with the dimensions of 23"x6"
- Glue a picture to each end of the base and nail the plexiglass down over each picture.
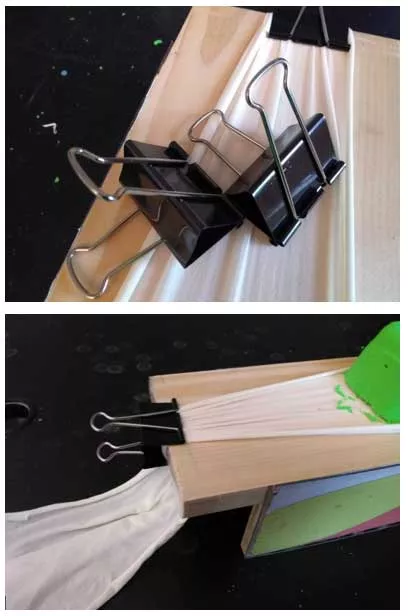
- Cut a leg to the stocking off by cutting at the top of the leg and cut the foot part off as well. Next, cut up the side of the tight to open it up.
Steps for Using the Model:
- Place one package of the kinetic sand inside of the plastic container. Pack it down very well. (Note: be sure to pack around the sides of the container well)
- Place the cut open tights leg of the top of the base.
- Turn the plastic container with the kinetic sand over the board and tights so that way the sand comes out of the mold over the center of the magma where it is pushed up.
- Have one person at each end of the stocking and you'll each pick up an end and start pulling (stretching) the tight very slowly. As you keep pulling, you will see the rift begin to form.
- Once you’ve stretched the stocking as far as you can, apply a binder clip to each end of the tight to keep it from moving back to its original position. By doing this, it allows you to take time to talk to the students about what they just seen happen.
Video guide: Discovery Atlas The Great Rift Valley
You will be watching a 40-minute documentary about the East African Rift. Please use this video guide to answer questions about the film. Questions go in order of the film. (Link to purchase video $2.99)
1. How old is the East African Rift?
2. In what part of Africa did extreme heat and pressure begin to cause hot, molten rock to rise and cause doming?
3. Why do lesser flamingoes thrive in Lake Bogoria? How did the rift contribute?
4. What forced the rift to split?
5. What are the names of the three Great Lakes?
6. How long ago did Lake Tanganyika form?
7. How long is Lake Tanganyika?
8. What could be a possible reason for the drop-in water level in Lake Tanganyika?
9. What is the most important feature distinguishing humans from apes?
10. How did the rift impact the tropical rainforests that the apes were living in?
11. How did this change contribute to the rise of Homo Erectus?
12. What caused soil to be so fertile?
13 ) Using the information from the video, class and your own research write a paragraph on how you think the world would be like if the African rift valley didn’t exist. Think about the landscape, wild life, and other factors that depend on the development of the rift.
Rift Valley Model Video
Suswa Rift, Kenya Video
|
|
0 |
1 |
2 |
3 |
4 |
|---|---|---|---|---|---|
|
Vocabulary |
Did not include and vocabulary words |
Vocabulary used but not used clearly and concisely |
The student clearly and concisely incorporates 2 or less vocabulary words
|
The student clearly and concisely incorporates the 3 to 4 vocabulary words
|
The student clearly and concisely incorporates 4 to 5 vocabulary words |
|
Video interpretation |
Does not refer to and use examples from the video |
Refers to video but does not use examples from the video
|
Refers to and uses examples from the video with no detail.
|
Refers to and uses examples from the video with little detail. |
Refers to and uses examples from the video with detail. |
|
Topic |
The topic is not of interest to the audience |
The topic is of interest to the audience, but is not presented clearly/in an organized manner |
The topic is of interest to the audience, but the level of detail is not appropriate for audience and/or the presentation of topic is unclear or lacks organization |
The topic is of interest to the audience, the level of detail is partially appropriate, and the topic is presented clearly with organization evident |
The topic is of interest to the audience, and appropriate for the role of the author and the format of the presentation. The topic is presented in an organized and clear manner, with a level of detail appropriate to the audience |
|
Mechanics |
Significant errors in grammar or style (5+) Hinders comprehension
|
Significant errors in grammar or style (5+)
|
Significant errors in grammar or style (3+) But can be understood |
There are minimal errors in grammar or style (no more than 3) |
There are no errors in grammar or style that detract from the presentation |
Tidal Circulation
Wind Shear
Wind Shear Model Lesson Plan
Prior knowledge: The students will have been taught about air masses and the differences in density in hot and cold air.
Activity: Students are asked to take out a piece of paper and draw what they are seeing while the model is rotating. After the students draw what they see, they will talk with a partner about what they are seeing and try to make sense of what they are seeing. The students should come to the conclusion that the difference in air velocities causes the rotation of the bottles. The teacher will then make the connection with the rolling bottles to the rolling columns of air.
Key Vocabulary: Velocity, friction, rotation
To go off this lesson, the students will be taught that the air masses causes the uplift of the rotating column YouTube clip to have the students identify the rolling column of air.
Wind Shear: Rotating Model
Carlie Perretta
Amber Piper
Julia Valentino
Standards This Model Can Help Portray:
Next Generation Science Standards:
- MS-ESS2-5: Collect data to provide evidence for how the motions and complex interactions of air masses results in changes in weather conditions
- MS-ESS3-2: Analyze and interpret data on natural hazards to forecast future catastrophic events and inform the development of technologies to mitigate their effects.
- HS-ESS2-8: Evaluate data and communicate information to explain how the movement and interactions of air masses result in changes in weather conditions.
- Which weather map symbol is used to represent violently rotating winds that have the appearance of a funnel-shaped cloud?
- June 2012 regents exam: 75. Use the standard two-letter air-mass symbols to identify air-masses X and Y
New York State p12 Science Learning Standards:
- Standard 7: Key Idea 2: collect, collate, and process data concerning potential natural disasters in an area and develop an emergency action plan
- 2.1h Atmospheric moisture, temperature and pressure distributions; jet streams, wind; air masses and frontal boundaries; and the movement of cyclonic systems and associated tornadoes, thunderstorms, and hurricanes occur in observable patterns. Loss of property, personal injury, and loss of life can be reduced by effective emergency preparedness.
- 2.2i Weather describes the conditions of the atmosphere at a given location for a short period of time.
- 2.2m Most local weather condition changes are caused by movement of air masses.
Materials:
- 2 two liter bottles
- 18 index cards
- Two rods (equal length)
- 2 12 inch wooden rulers
- Wood glue
- Two wooden posts (equal length)
- Wood base board (longer than the 2-liter bottles)
- 4 screws
- Screw driver
- Sand paper
- 2 bolts
- 2 nuts
- 6 washers (you may need more or less, it depends on how well the model rotates)
- Drill
- Hot glue gun
- Two braces
- Mesh square
Procedure:
1. Rinse, dry and remove the labels from the 2-liter bottles.
2. Fold the index cards to create a 1-1 ½ inch tab to attach them to the bottles (make sure they do not touch cards from the second bottle when they rotate).
3. Using hot glue, glue the index cards onto the bottle, spacing them evenly apart. There should be 9 cards on each bottle.
4. Let this dry-While the glue is drying on the bottles, drill a small hole (the size of the rod) into one ruler one inch from the end. Repeat on the other end and then again with the second ruler. (These holes will be used for the rods)
5. Drill a larger hole in the middle of the ruler (the size of the bolt).
6. Drill a hole (the size of the bolt) in the face of the posts, approximately one inch from the end. It is important to make sure that these holes are in the same spot on both posts.
7. Measure the distance of the two posts onto the wooden base board, make sure they line up correctly or the bottles will not rotate properly.
8. Drill two screws into the bottom of the base board (just so that the tip is poking out the other side) so that it evenly matches up to the bottom of one post, do the same for the other post.
9. Drill the screws up into the posts
10. Using a bolt and two washers, bolt the rulers to the posts. Make sure the rulers can spin.
11. Slide the metal rods through the bottles and put each end of the rod into the ruler and then glue into place. Make sure the bottles can spin in place. Make sure the bottles are mounted facing opposite directions so one side is not heavier than the other.
12. Set up in front of box (or column) fan, elevation of model may vary, cover the bottom half of the fan with a mesh covering to represent slower moving air and get the fan to blow the bottles and the whole model.
What this model represents:
This model represents the rotation of air due to wind shear. During the formation of a tornado, there is fast moving air aloft and slow moving air at the surface causes there to be a rotating column of air. After looking at multiple 2D models, we realized that it was very hard to understand what was going on based off of arrows. The fast spinning bottle represent the fast air aloft, and the slow spinning bottle represent the slow air at the surface. The rulers (rotating both bottles) represent the rotating column of air. This model is to be paired with a visual diagram that shows the 2D model that we are trying to represent.
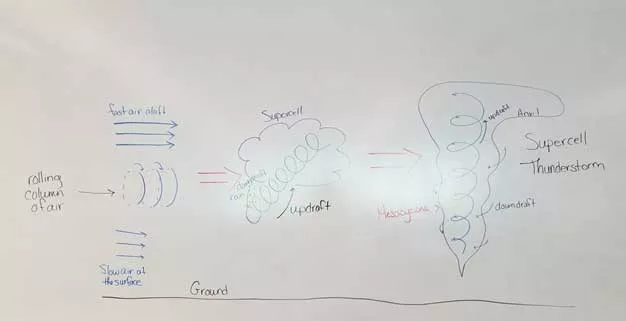
This is the static model that would be used to go along with our model.
Limitations:
Some limitations to this model is that it is not shown at a large scale, so the students have to assume that this is occurring over say a mile rather than the 12 inches that the bottles show and the fan represents miles of elevation into the atmosphere. Another limitation is that we do not have the model showing the uplift of the column. We resolved this issue by lifting one end of the base while the bottles were rotating to show that the air keeps rotating even though it is being uplifted. Lastly the biggest limitation that this model does not show is that the air does not always flow in the same direction before it forms the rotating column. Students may have the misconception that this is the only way that the air can flow during the formation of a tornado.
Evaluation of model:
Relatedness- This model can be related to the many static models that are out there as an aid to help students understand how air begins to rotate. This model supplements 2D models well as well as the gestural model of showing the rotation of air.
Transparency-The model depicts the rotation of air due to wind shear very well. It shows the fast moving air aloft and the slow moving air at the surface. There is slow velocity air at the surface because of the friction from trees, buildings, and mountains. The mesh square that is placed over the fan represents the friction that the wind faces while moving near the surface slowing it down.
Robustness- For this model the students have to assume that this is not a scale model of the rotating air. The model does not show large scale rotation very well, but it does show how large scale wind shear is forming.
Fertility- When trying to demonstrate wind shear, we wanted to create a model that showed how the rotating column formed because we had many misconceptions ourselves. The model shows that the fast moving air aloft is rotating at a speed that causes it to sink and then the slow moving air at the surface is uplifted to fill that void. The rotation of the two bottles then causes the rulers to rotate. There is a mesh over the lower part of the fan that represents the trees and friction that the surface winds are hitting causing them to be slower, and the top of the fan is uncovered representing the fast moving air aloft.
Ease of enrichment- In order to make this model more clear for the students, we added elevation markers on the side of the fan to show the difference in the air levels. We also talked about adding an image of mountains or trees to show what slows down the winds at the surface. Another aspect that could be added to this model is lifting one end of the base to show how the rotating air is uplifted.
Sea Floor Spreading
Seafloor Spreading Model
Haley Mooney
Amber Piper
Standards:
● MS-ESS2-2. Construct an explanation based on evidence for how geoscience processes have changed Earth’s surface at varying temporal and spatial scales. -ESS1.C: The History of Planet Earth: Tectonic processes continually generate new ocean sea floor at ridges and destroy old sea floor at trenches. (HS.ESS1.C GBE) (secondary to MS-ESS2-3)
● MS-ESS2-3. Analyze and interpret data on the distribution of fossils and rocks, continental shapes, and seafloor structures to provide evidence of the past plate motions.
● HS-ESS2-3. Develop a model based on evidence of Earth’s interior to describe the cycling of matter by thermal convection.
● HS-ESS2-1. Develop a model to illustrate how Earth’s internal and surface processes operate at different spatial and temporal scales to form continental and ocean-floor features
● HS-ESS1-5. Evaluate evidence of the past and current movements of continental and oceanic crust and the theory of plate tectonics to explain the ages of crustal rocks
Materials:
● Plexiglass
● wood blocks (jenga pieces)
● String
● Heavy duty stapler
● Paper
● black and brown spray paint
● colored pencils/markers
● hot glue gun
● 4 rulers
● Wood saw
● safety glasses
● clamps
● wood board
● packing tape
● scissors
How to:
● Obtain a large piece of plexiglass and a sizeable wood board.
● Make two slits into the board (one on each end to secure a tab from the plexiglass into the board) leaving about 10 inches on each side.
● The two slits are for the plexiglass to slide into.
● Measure out the width of the two slits and cut two tabs at each end of the plexiglass so it can smoothly slide into the wood on each side, remembering that you want an arch shape for the plexiglass.
● Cut about a 4x4 inch square out of the middle of the plexiglass (this can be adjusted if needed).
● Underneath, take two rulers and place them on alternating sides offset of each other creating two ramps from the 4x4 hole in the plexiglass.
● Glue them in place with the hot glue gun.
● Create sides on the ramps to keep the blocks from falling off by fitting two more rulers using hot glue on the side of each ramp.
● Grab 18 jenga wooden blocks and make two separate chains of 9 by taking string and a stapler. -Spray paint them black
● Spray paint the plexiglass brown
● Add two wooden blocks on the ends of each train of “basalt” to represent the continents.
● Draw a diagram for what is going on underneath the surface using colored pencils.
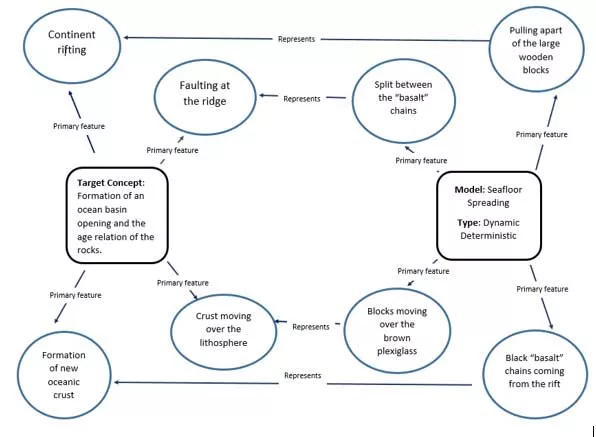
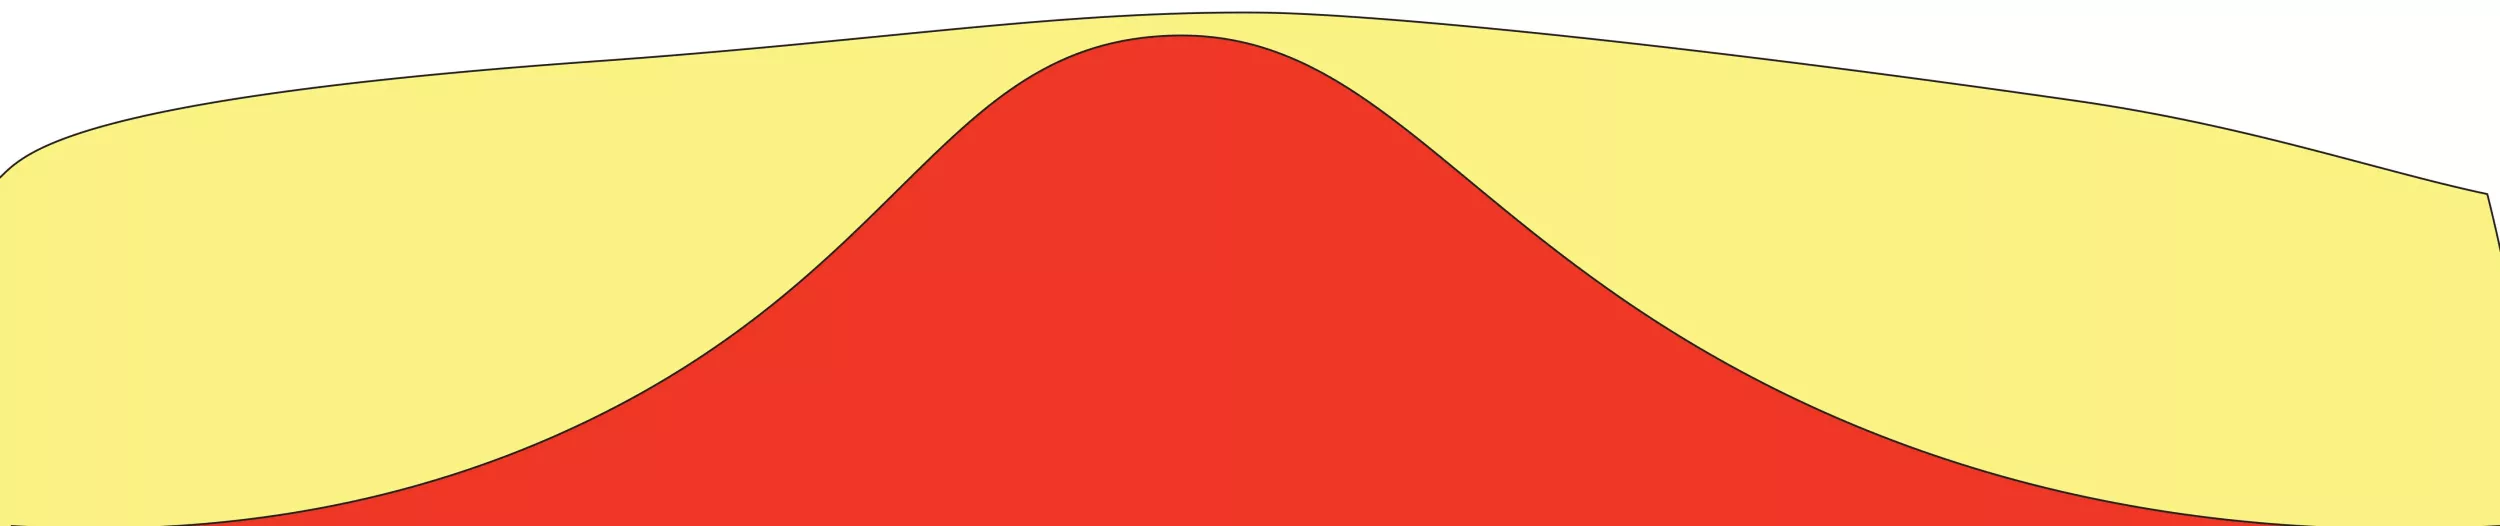
The model is now complete. The black spray painted blocks are basaltic crust of the oceanic lithosphere, the brown plexiglass is the asthenosphere, the two wooden blocks attached to the trains of basalt are North America and Africa, the ocean basin being formed is the atlantic ocean. The ruler ramps being offset represents a thrust fault. Remember: This happened over many years!
What it represents:
● Continents rifting apart (North America/Africa)
● Formation of an Ocean basin (the Atlantic)
● Thinning of continental crust and formation of new oceanic lithosphere
● Time reference, the newest lithosphere in the center ages as it moves outward
● Relative position of lithosphere above the asthenosphere
● Clarification of the fact that the crust is part of the lithosphere
● Presentation of a thrust fault
● Mantle convection
● Time scale (billions of years)
● You can bring up dating methods used to explain how we know the ages of the rocks. Explaining why the newest crust is in the center of the ridge and gets older as you move toward the continents.
Description of the Model development process:
We started out thinking of ways to show the Carbon Cycle in a physical model but shifted our focus to the mid ocean ridge because the carbon cycle has many aspects that are difficult to present in a single physical model. We spent time researching the processes behind the mid ocean ridge and thought of ways we could present his in a physical model. We also spent some time looking at existing models and trying to figure out what the weak point of those models were and how we could improve upon them. We decided on showing the creation of new material at the center of the ridge and tried to think of different materials that might work; we thought of using a paper model, play-doh, paraffin wax, legos, blocks and various other items that did not seem to work well for what we wanted to show. We had the idea of showing blocks (representing new basaltic ocean crust) coming from below a surface and spreading out on top of the surface as it gets older. We started playing around with plexiglass and making an arched surface. After that we had the idea of cutting into the plexiglass and mounting it on wood. We wanted to show both the process that is going on below the lithosphere along with what is happening at the surface. We drew a diagram that shows convection in the mantle and would use this along with Dr. Ebert’s model of convection. Then we added two blocks representing continents that we attached to the basaltic crust that is being pulled along the top of the plexiglass. This shows what happened when continents rift apart resulting in the formation of new oceanic crust. As the continents continue to move apart farther away from the center ridge, the material gets older.
Model Assessment:
Relatedness- the model fits well with other 2D and 3D representations of our target
Transparency- the model is very transparent, it shows the target well in a dynamic fashion
Robustness- assumptions of scale (size and geologic time) and that wooden blocks represent slabs of rock are necessary
Fertility- the model has great fertility, it explains much about the target in one model
Ease of enrichment- the model has room to add on and extend
Model Target Map