Current Initiatives
Starting with CIT 2014 in May of 2014, the team will make the VIDIA environment available to others in SUNY. Questions about this can be directed to Jim Greenberg via email at jim.greenberg@oneonta.edu.
Dr. Koedderman
Initial Analysis of Texts done by Jim Greenberg, Sept. 2014
Simple Text Analysis of Apology, Crito, Euthyphro, Meno, and Symposium
Texts were downloaded from the Gutenberg site at http://www.gutenberg.org in Plain Text UTF-8 format. These documents had additional text about fair use and copyright as well as translation notes. This extra text was removed before doing the analysis.
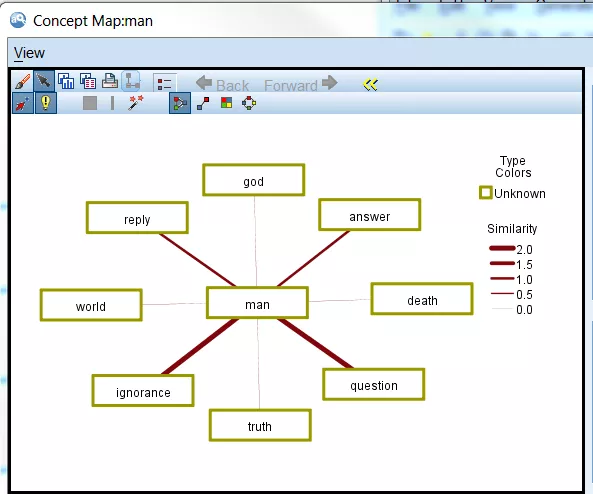
IBM’s Modeler 16 Text Analytics was used to produce the concepts maps of each provided below. View details on how this software works
For Apology, the concept “man” was extracted and mapped. It appears below:
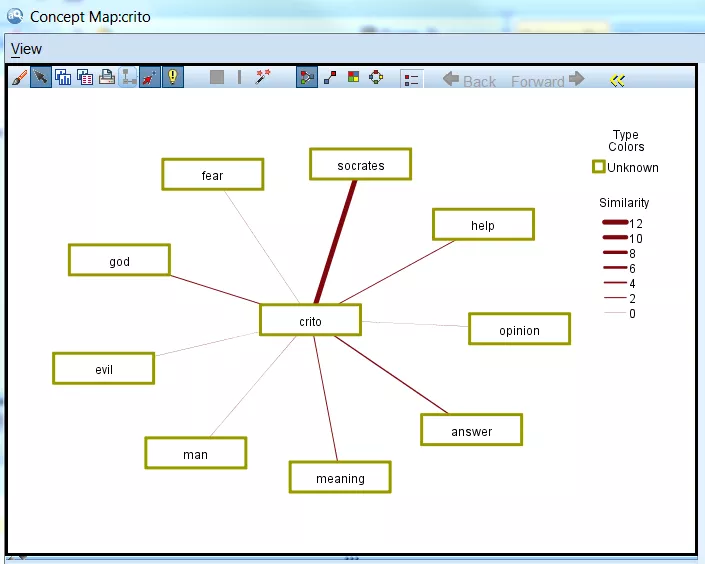
For Crito the concept “crito” was extracted and mapped.
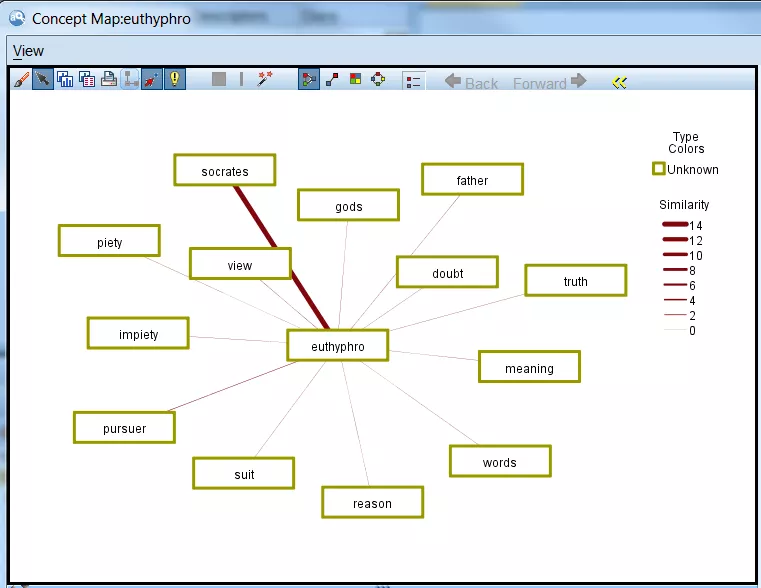
For Euthyphro the concept euthyphro was mapped
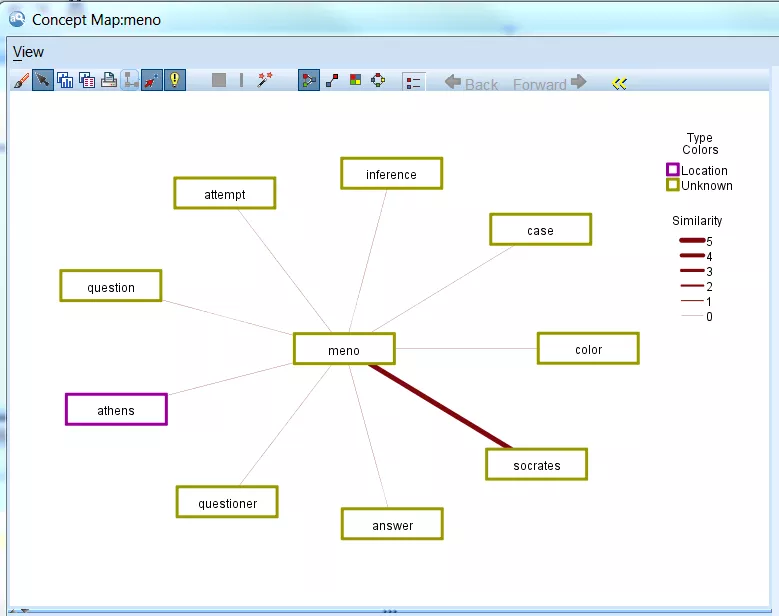
For Meno the concept “meno” was mapped (the maximum number of concepts to map was reduced from 15 to 9 for this visual):
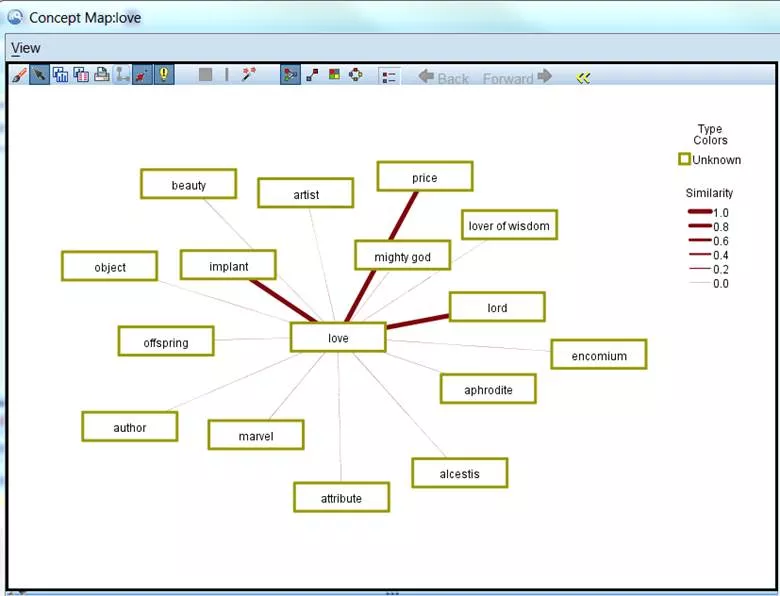
For Symposium the concept “love” was mapped:
Synopsis of Big Data Teaching-Related Projects for Spring 2014
Gregory Fulkerson: Assistant Professor (Sociology)
Using Rapid Miner to conduct co-occurrence and K-means cluster analysis on Twitter data in his Social Research Methods course (Sociology 209). Students are capturing data using Trackur and upload these data to VIDIA for analysis and visualization.
Brian Lowe, Associate Professor (Sociology)
Using Rapid Miner to conduct co-occurrence and K-means cluster analysis on Twitter data in his Animals and Society course (Sociology 294). Students are capturing data using Trackur and upload these data to VIDIA for analysis and visualization.
Bill Wilkerson, Associate Professor (Political Science)
Using Rapid Miner to conduct co-occurrence and K-means cluster analysis on Twitter data in his Approaches to Political Science course (Poly Sci 200). Students are capturing data using Trackur and upload these data to VIDIA for analysis and visualization.
Synopsis of Big Data Teaching-Related Projects for Fall 2013
Gregory Fulkerson: Assistant Professor (Sociology)
The current incorporation of Big Data in my courses include the Social Research Methods and Rural Sociology courses. For Social Research Methods, the use of trackur will be used by students to identify relevant media to their semester projects. The data will be collected, downloaded to a file, and then opened in IBM SPSS Modeler to perform text analytics. For the Rural Sociology course, the scope is somewhat more focused on media sources relevant to the public imagination of rural life and rural people, paying particular attention to stereotypes that are circulating. In both courses, there is an opportunity to discuss issues of data quality and research generally, including sampling issues, measurement validity, and ethical issues.
Brett Heindl: Assistant Professor (Political Science)
I am using Trackur and Modeler in a short group assignment for my European Politics class. Working in groups of three, the students will choose a topic of interest in contemporary European politics (e.g. financial crisis and bailouts; possible intervention in Syria; Turkey's application for membership in the EU; the rise of far right political parties, etc.), and then write a short background piece to contextualize the debate and to situate it in the relevant course materials. They'll then use trackur to gather a sizable number of tweets and Facebook status updates on this debate. After running this material through Modeler, they'll discuss the ways the debate is framed and these frames' implications for public policy. A final section will ask them to reflect on the practical uses of big data and the ethical and methodological challenges it poses.
Brian Lowe: Associate Professor (Sociology)
As part of Senior Seminar (Sociology 390) students will utilize Trackur in order to explore claims made in Twitter as they inform topics related to their term paper topics. Students will be divided into small groups (between two to five members) based on either the substance and/or theoretical orientation of their individual term papers. Students will also be required, in constructing their use of Trackur, to address the dimensions of claims making and strategies within their sampled social media. Students were assigned Joel Best’s Social Problems (2013) and James Jasper’s Getting Your Way (2006) as required core readings. This assignment requires them to consider how claims and claims making are reflected in their sampled materials and to address what forms of strategic actions are evident in these materials.
Bill Wilkerson, Associate Professor (Political Science)
I am deploying an assignment very similar to Greg Fulkerson’s in my POLS 200 Approaches to Political Science course: students will collect, analyze and report on social media related to a topic of their choice. As for research, I am using a variety of sources--Google searches, Wikipedia page hits, tweets and other social media--to get a develop a sense of the salience of the supreme court as an institution and to measure the relative salience of individual supreme court decisions.
Spring 2013
Social Research Methods - Dr. Gregory Fulkerson
As a data analysis exercise for a Social Research Methods course, I assigned my students the task of searching for Twitter Tweets using terms relevant to their semester-long research question. This builds upon a literature review that they completed earlier in the semester and dovetails with a research design paper due at the end of the semester. More specifically, the students used the website, Trackur.com, to perform their searches. The learning outcomes of this assignment were to further enhance the data analysis capabilities of students in general and specifically to sharpen their qualitative coding using Microsoft Excel. The students downloaded the Excel file that was created through the search process, and then added columns for variables related to the themes in the tweets. For example, in a search for Fracking, I demonstrated how one could go through Tweets and identify the theme of "environmental impacts." These themes were coded as 0/1 for absence or presence. After completing the binary coding, the students created a chart to graphically show the frequency of different themes in the twitter database they created. After completing the analysis, the students prepared a report interpreting the analysis. Both the coded tweets and the report they wrote were submitted for credit. The advantages of the exercise were that students were able to engage in first-hand data collection and analysis with respect to social media. The disadvantage of the exercise is that they were limited to 100 tweets worth of analysis as there were not automated analysis tools available for them (hand coding was required). In the future, I would like to be able to teach some of the new automated Big Data analysis tools, such as those being developed by IBM SPSS. In addition, while Trackur makes the search and download process streamlined and has a friendly user-interface, it misses a number of tweets and is prone to slow response times, meaning there is often a lag time when trying to download the results.
IBM SPSS Modeler is a data mining workbench that helps you build predictive models quickly and intuitively, without programming. This project was fortunate to have IBM donate this software under their Solutions for Education program. The team is currently working through the technical issues deploying these tools campus wide. Issues such as server licensing, pushing client installs, modification of documentation for undergraduates, and collection of videos and training materials into a library for students is currently underway. In addition team members are scheduled to attend IBM seminars on how to use these tools.
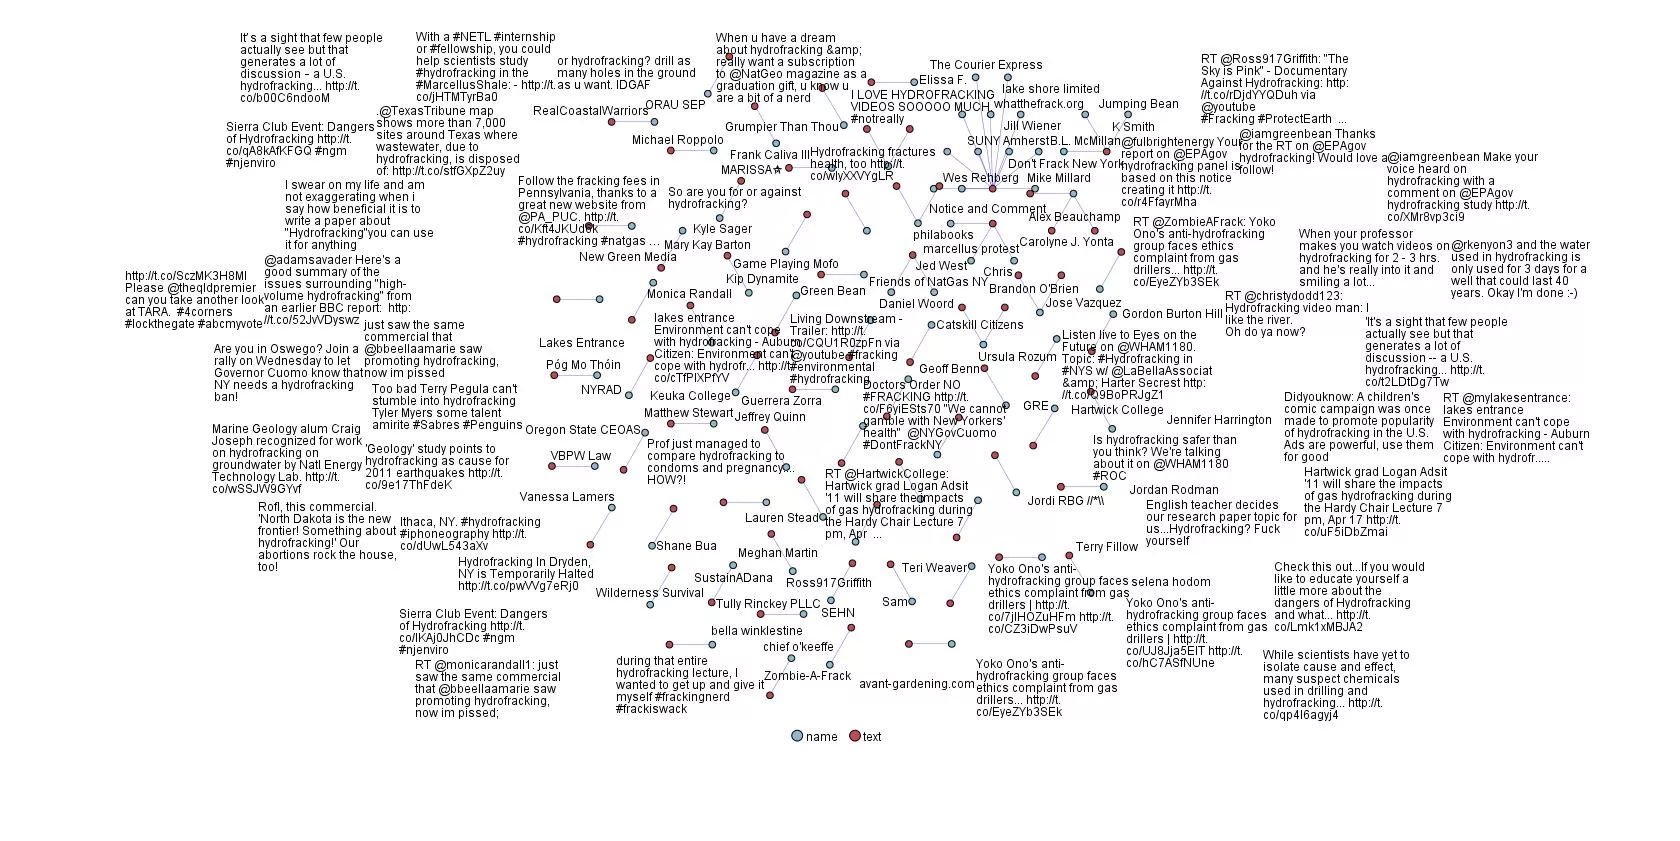
Currently the team is building examples of how to take Twitter data in JSON format, convert that data into XML so it can be loaded into the IBM Modeler software and then some initial visualization of the data be performed. In the two screenshots below you can see the conversion of the JSON Twitter data into XML by a tool called XMLSpy from Altova (Figure 1.) and then that data visualized using the Web Node tool in the IBM Modeler software (Figure 2.). A video on basic text analysis of Tweets using Modeler can be found here.
Figure 1. Altova Json to XML
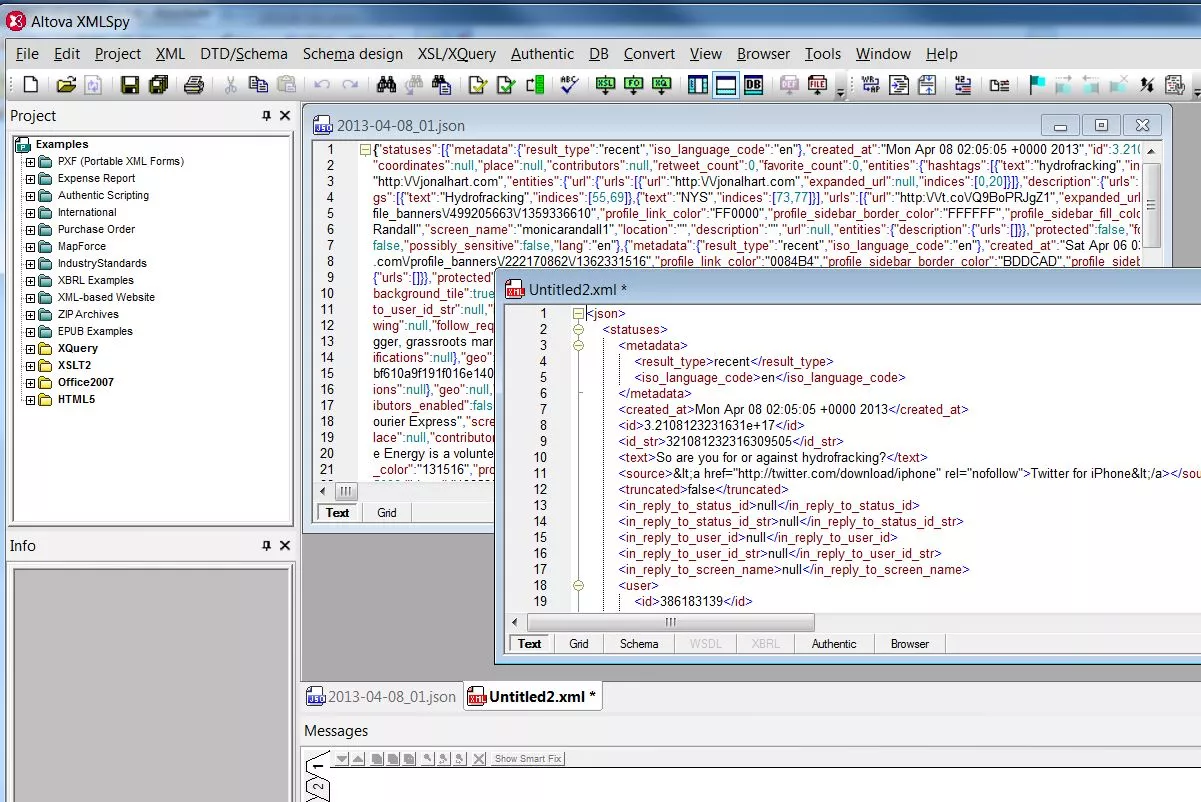
Figure 2. Web of text x name _ Absolute
Using Twitter API's to Capture Data
Using available documentation on the web, the team has written its own Twitter capture program. The program is scheduled to run on a regular basis and do searches for key terms the team has identified. Data is being collected in a large storage facility provided by SUNY Oneonta at paid for under the grant. This data is in JSON format and an additional piece of software called Altova XMLSpy was purchased to convert this data to XML. This was necessary because no analysis software we have to date can read and process JSON format.
References for Capturing and Using Twitter Data
Twitter Analytics: A Beginner's Guide. (n.d.). Search Engine Watch. Retrieved October 11, 2013.
Retired Projects
Being able to map the spatial characteristics of social media is a key element in the environment. Students in all disciplines need to have experiences with spatial data and the use and limitations inherent within. Team member Nicholas Perugini (student) developed a JAVA application that takes specially prepared files of Tweets and creates KMZ files for use in Google Earth. A sample of such a KMZ can be found here (note this file has been edited to ensure privacy and should only be used as an illustration of how Tweets can be mapped). For more information on this program send Jim Greenberg an email at jim.greenberg@oneonta.edu.
Exploration of Twitter Streams
Many Eyes is an experiment brought to you by IBM Research and the IBM Cognos software group. You can upload your own datasets to this site and use the many visualization tools there. We have uploaded a couple of our initial Twitter capture data sets and started to look at various visualization tools in Many Eyes and how this site might be a good starting point for students. It is simple to use, a very short and gentle learning curve and has some nicely done tools. As an example, below is a visualization done of the Twitter data showing not only a word count, but you can access the original tweets by hovering over any word.
A Commercial Social Media Capture Tool
Trackur is a commercially available social media capture tool purchased to use building datasets. Trackur is inexpensive, very easy to use, and most importantly for this project, has a save to Excel feature that is ideal for undergraduate work.
So far work with Trackur has been proceeding very well. Undergraduates pick up how to use the software quickly and can make use of the data in their course work. Trackur "stays out of the way" cognitively for students so they can concentrate on their research questions and not get distracted by having to learn complicated software.
Creation of student accounts in Trackur is not idea since all accounts (profiles) have to be created manually. To expedite this, a Windows automation tool called Win Task was purchased and a script developed to automatically fill in this web form. The process was written by Diana Moseman, a programmer for the team.
A screenshot of the Trackur interface is provided below:
Creative Commons
This work is licensed under a Creative Commons Attribution-NonCommercial-ShareAlike 4.0 International License.